Electric vehicle pioneer Tesla (NASDAQ: TSLA) fell short of the market’s revenue expectations in Q2 CY2025, with sales falling 11.8% year on year to $22.5 billion. Its non-GAAP profit of $0.40 per share was in line with analysts’ consensus estimates.
Is now the time to buy Tesla? Find out by accessing our full research report, it’s free.
Tesla (TSLA) Q2 CY2025 Highlights:
- Vehicles Delivered: 384,122 vs analyst estimates of 397,843 (3.4% miss)
- Revenue: $22.5 billion vs analyst estimates of $22.74 billion (1.1% miss)
- Operating Profit (GAAP): $923 million vs analyst estimates of $1.21 billion (23.6% miss)
- EPS (non-GAAP): $0.40 vs analyst expectations of $0.40 (1.1% miss)
- Automotive Revenue: $16.66 billion vs analyst estimates of $16.53 billion (small beat)
- Energy Revenue: $2.79 billion vs analyst estimates of $3.22 billion (13.3% miss)
- Services Revenue: $3.05 billion vs analyst estimates of $2.97 billion (2.5% beat)
- Gross Margin: 17.2%, in line with the same quarter last year
- Operating Margin: 4.1%, down from 6.3% in the same quarter last year
- Free Cash Flow Margin: 0.6%, down from 5.3% in the same quarter last year
- Market Capitalization: $1.07 trillion
Revenue Growth
Tesla proves that huge, scaled companies can still grow quickly. The company’s revenue base of $25.71 billion five years ago has more than tripled to $92.72 billion in the last year, translating into an incredible 29.2% annualized growth rate.
Over the same period, Tesla’s automotive peers Rivian, General Motors, and Ford put up annualized growth rates of 195%, 10.1%, and 4%, respectively. Just note that while Rivian has the most similar vehicles to Tesla, comparisons aren’t exactly apples-to-apples because it’s growing from a much smaller revenue base and selling its EVs at a loss. 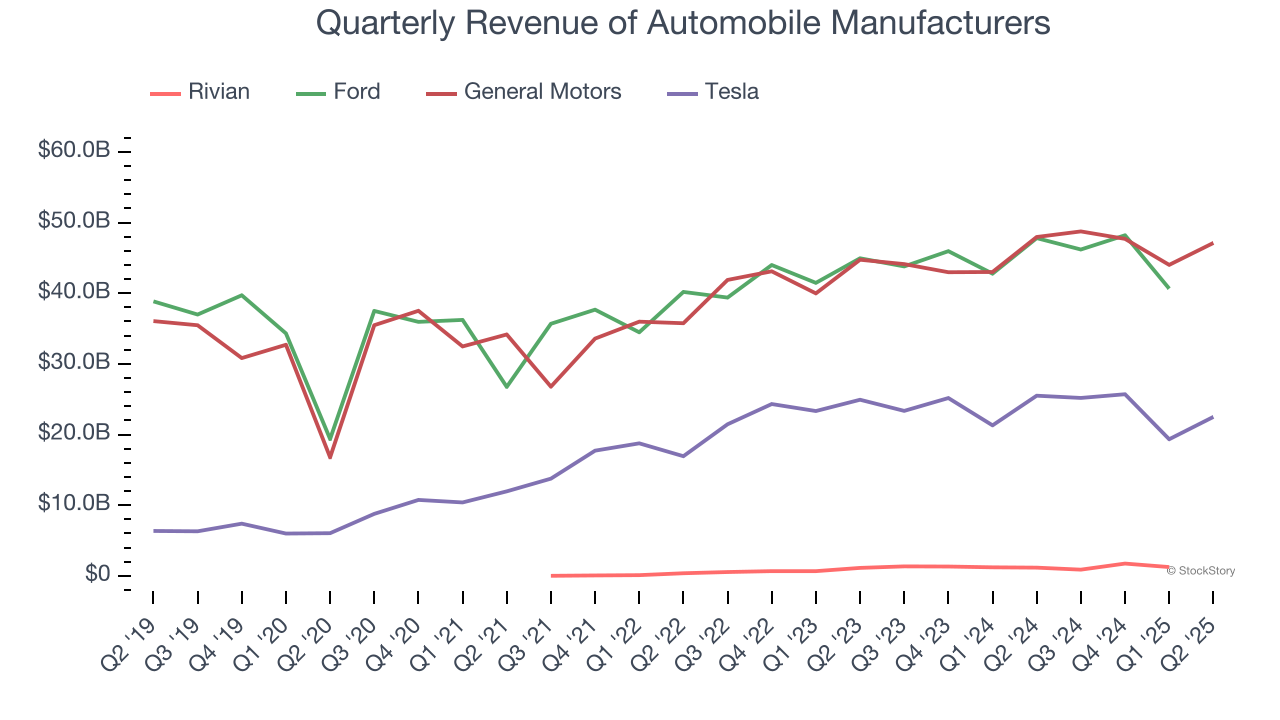
Long-term growth reigns supreme in fundamentals, but for disruptive companies like Tesla, a half-decade historical view may miss emerging trends in autonomous vehicles and energy. Tesla’s recent performance shows its demand has slowed significantly as its revenue was flat over the last two years. 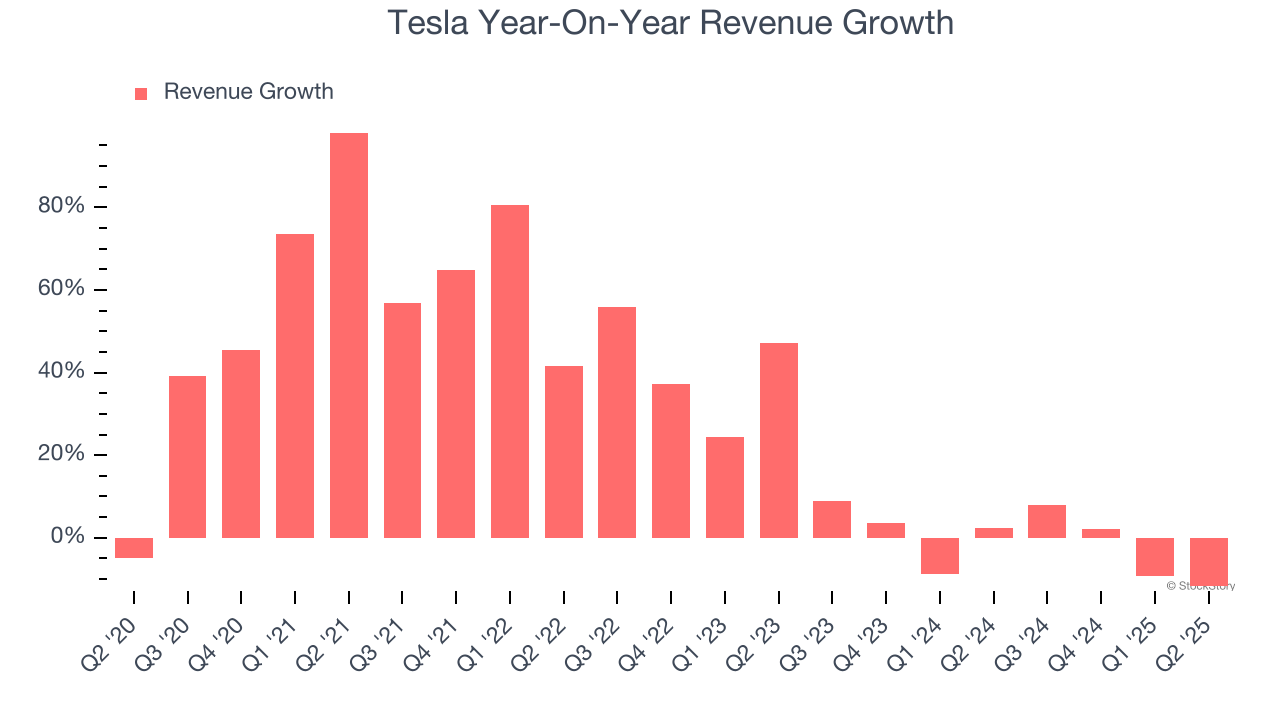
This quarter, Tesla missed Wall Street’s estimates and reported a rather uninspiring 11.8% year-on-year revenue decline, generating $22.5 billion of revenue. Looking ahead, sell-side This projection is admirable for a company of its scale and illustrates the market is baking in success for its newer products.
Unless you’ve been living under a rock, it should be obvious by now that generative AI is going to have a huge impact on how large corporations do business. While Nvidia and AMD are trading close to all-time highs, we prefer a lesser-known (but still profitable) stock benefiting from the rise of AI. Click here to access our free report one of our favorites growth stories.
Automotive: Act One
Revenue: The Race For Dominance
Tesla is primarily an automobile manufacturer today and generates 76% of its revenue through the sale and leasing of EVs. It historically produced expensive, high-end EVs, but after years of operating losses, has shifted its focus to the mass market with affordable vehicles. The Model 3 and Model Y (released in 2017 and 2019) are the headliners of this story, and we’ll dive into their impacts below.
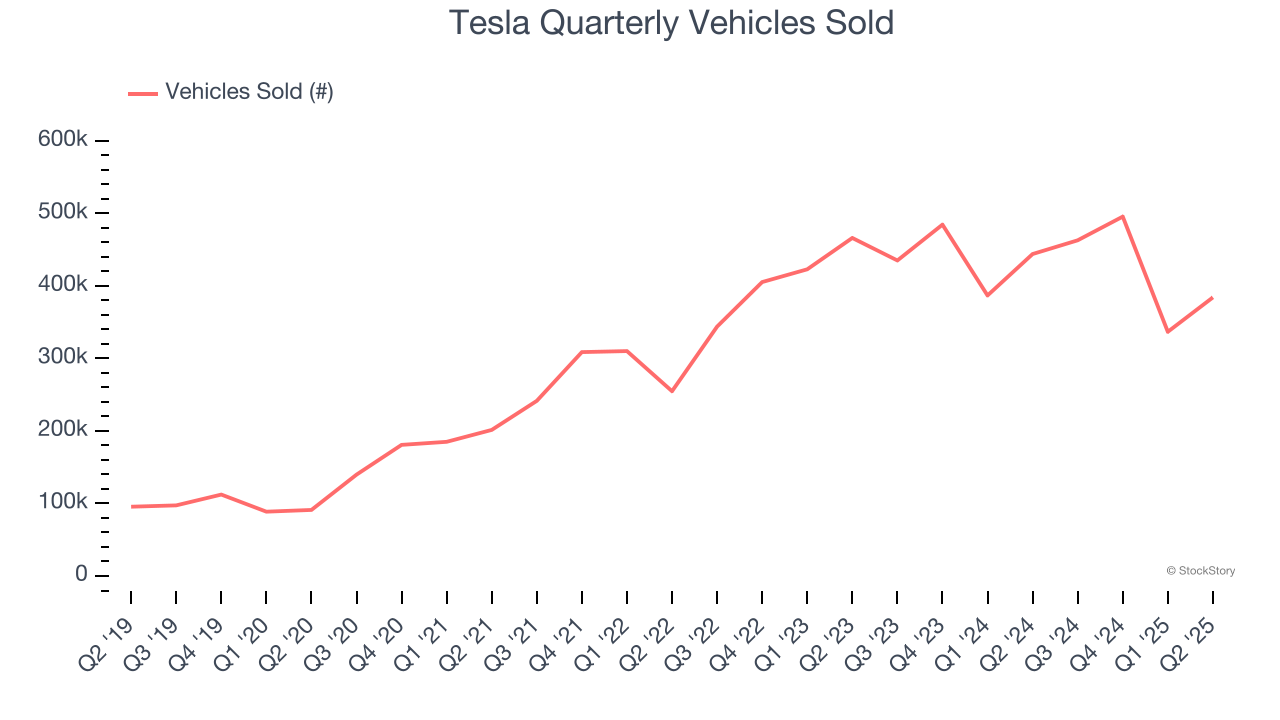
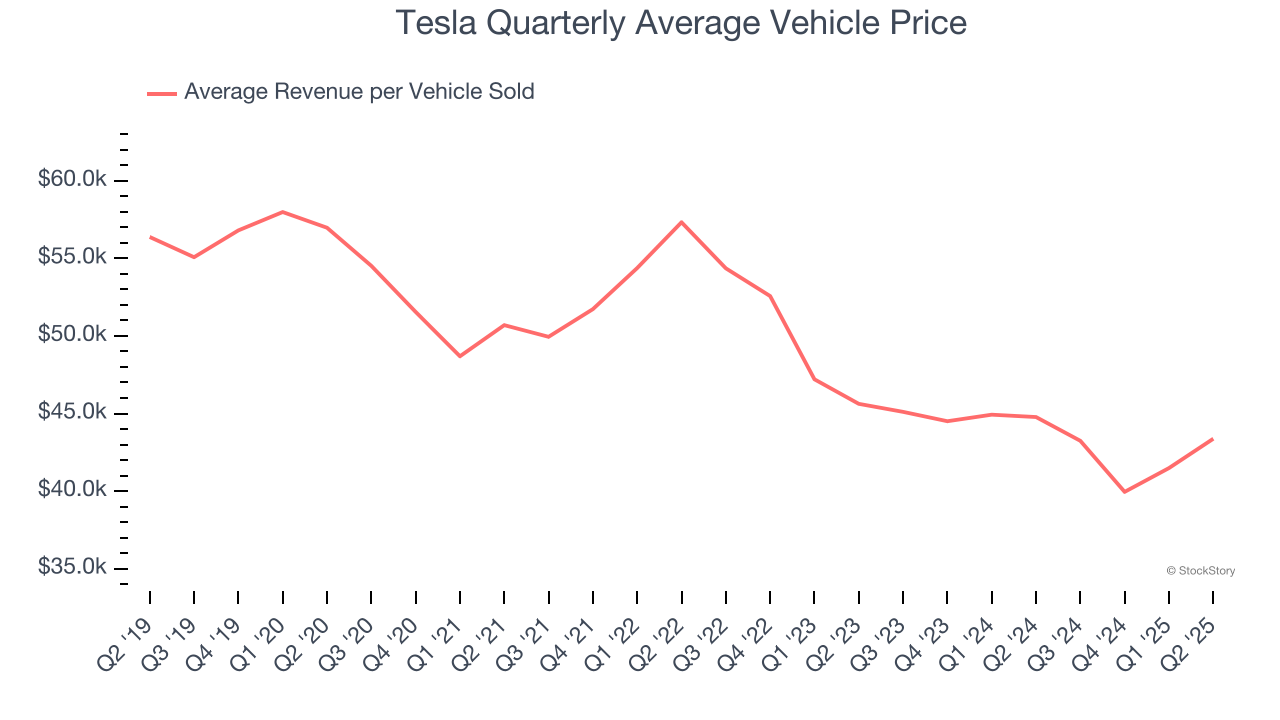
Over the last five years, Tesla’s vehicles sold grew by 34% annually to 1.68 million units in the last year. This is meaningfully above the its 26.2% annualized growth rate for Automotive revenue, implying that its average vehicle price fell.
Specifically, Tesla's average revenue per vehicle sold was $41,948 for the trailing 12 months, noticeably lower than the $56,686 price tag in 2020.
These unit and pricing trends uncover three facets of the company’s automotive business:
1) It has achieved its goal of selling more Model 3 and Model Y vehicles, which carry lower price tags than other models, 2) the scaling production of its mass-market models is boosting manufacturing efficiency because it lowers the fixed cost per vehicle sold, and 3) rather than increasing profitability by reaping the cost-saving benefits, Tesla is passing them to customers through price reductions.
In Q2, Tesla’s vehicles sold shrank by 13.5% year on year to 384,122 units and missed Wall Street’s expectations. Putting this print side-by-side with its 16.2% Automotive revenue decline suggests an average vehicle price of $43,374, down from $44,775 in the same quarter last year.
Unit Economics: The Impact Of Price Cuts
There’s no denying automobile manufacturing is a tough business. Few upstarts succeed because incumbents like General Motors and Ford can afford to break even on the initial sale of vehicles and instead make money on parts and servicing, which come many years down the line. This is why new entrants such as Rivian have negative gross margins - they must price competitively, and their fleets are too young to generate substantial aftermarket revenues.
Tesla does not disclose the operating profitability of its segments, but we can analyze the gross margins of its various divisions to see how it stacks up. For Automotive, this metric reflects how much revenue is left after paying for the raw materials, components, and direct labor costs that go into manufacturing and producing its vehicles.
Thankfully for investors, Tesla has crossed the chasm as its Automotive segment boasted an average gross margin of 22.8% over the last five years. While it may be low in absolute terms, Tesla’s margin was best in class for the industry and illustrates its superior pricing power and procurement capabilities. Its breathing room also explains why the company can squeeze its competitors by slashing prices.
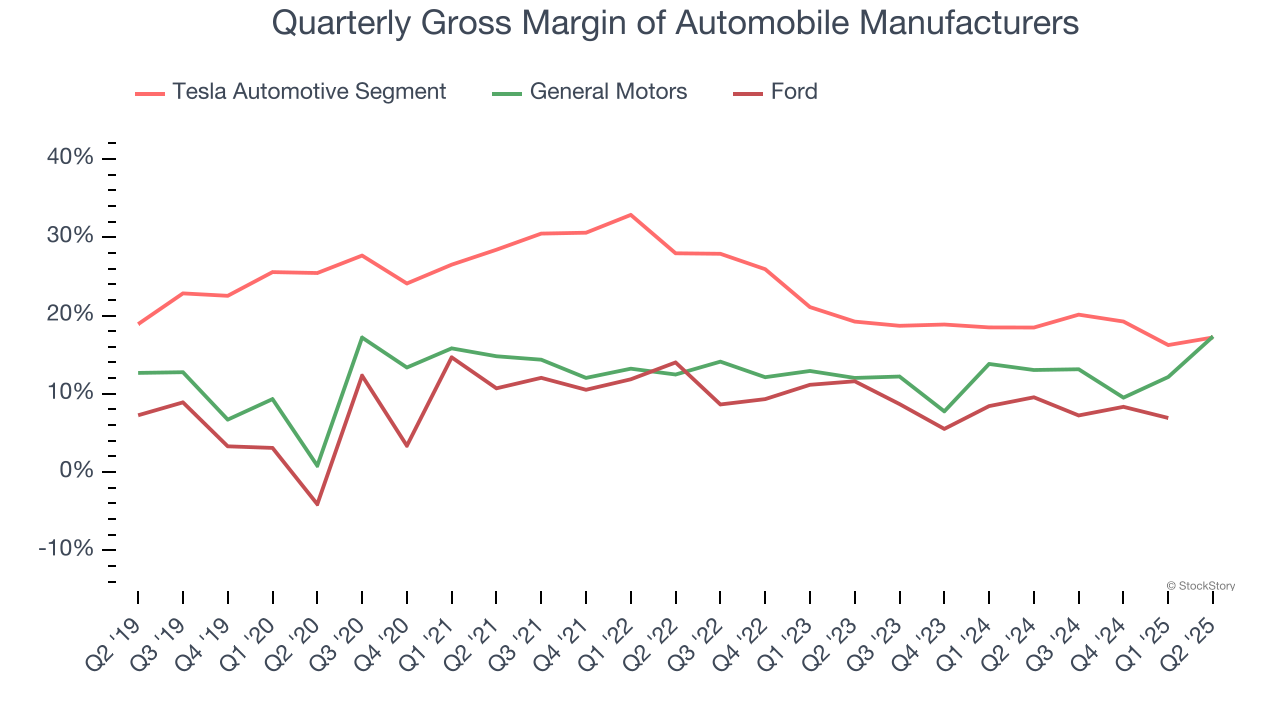
Looking under the hood, Automotive’s annual gross margin fell from 24% five years ago to 18.4% in the last year. This is a direct result of its price cuts and shows the company is sacrificing higher profits today to increase its installed base and potentially secure longer-term recurring revenue streams. Its gross margin ticked lower this quarter to 17.2%.
Key Takeaways from Tesla’s Q2 Results
We struggled to find many positives in these results. Its revenue missed, as the miss in Energy trumped the beat in Services and in-line print for Automotive. Overall, this was a weaker quarter. The stock traded down 3.7% to $320.57 immediately following the results.
Tesla’s latest earnings report disappointed. One quarter doesn’t define a company’s quality, so let’s explore whether the stock is a buy at the current price. When making that decision, it’s important to consider its valuation, business qualities, as well as what has happened in the latest quarter. We cover that in our actionable full research report which you can read here, it’s free.