Security hardware provider Allegion (NYSE: ALLE) reported Q2 CY2025 results beating Wall Street’s revenue expectations, with sales up 5.8% year on year to $1.02 billion. Its non-GAAP profit of $2.04 per share was 2.7% above analysts’ consensus estimates.
Is now the time to buy Allegion? Find out by accessing our full research report, it’s free.
Allegion (ALLE) Q2 CY2025 Highlights:
- Revenue: $1.02 billion vs analyst estimates of $1.01 billion (5.8% year-on-year growth, 1.5% beat)
- Adjusted EPS: $2.04 vs analyst estimates of $1.99 (2.7% beat)
- Adjusted EBITDA: $258.1 million vs analyst estimates of $252.2 million (25.3% margin, 2.3% beat)
- Management raised its full-year Adjusted EPS guidance to $8.08 at the midpoint, a 4.2% increase
- Operating Margin: 21.5%, in line with the same quarter last year
- Free Cash Flow Margin: 18.8%, up from 15.8% in the same quarter last year
- Organic Revenue rose 3.2% year on year (5.2% in the same quarter last year)
- Market Capitalization: $13.28 billion
Company Overview
Allegion plc (NYSE: ALLE) is a provider of security products and solutions that keep people and assets safe and secure in various environments.
Revenue Growth
Examining a company’s long-term performance can provide clues about its quality. Any business can have short-term success, but a top-tier one grows for years. Over the last five years, Allegion grew its sales at a mediocre 7.2% compounded annual growth rate. This was below our standard for the industrials sector and is a rough starting point for our analysis.
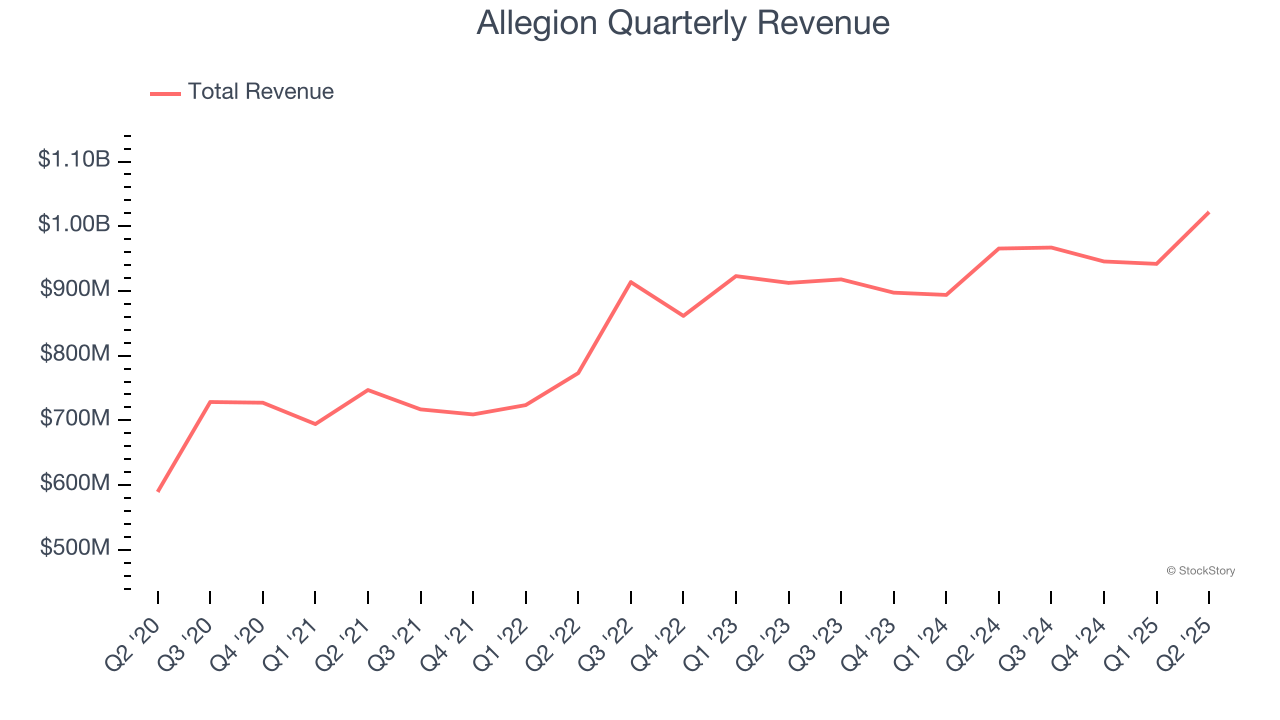
Long-term growth is the most important, but within industrials, a half-decade historical view may miss new industry trends or demand cycles. Allegion’s recent performance shows its demand has slowed as its annualized revenue growth of 3.6% over the last two years was below its five-year trend. We also note many other Electrical Systems businesses have faced declining sales because of cyclical headwinds. While Allegion grew slower than we’d like, it did do better than its peers. 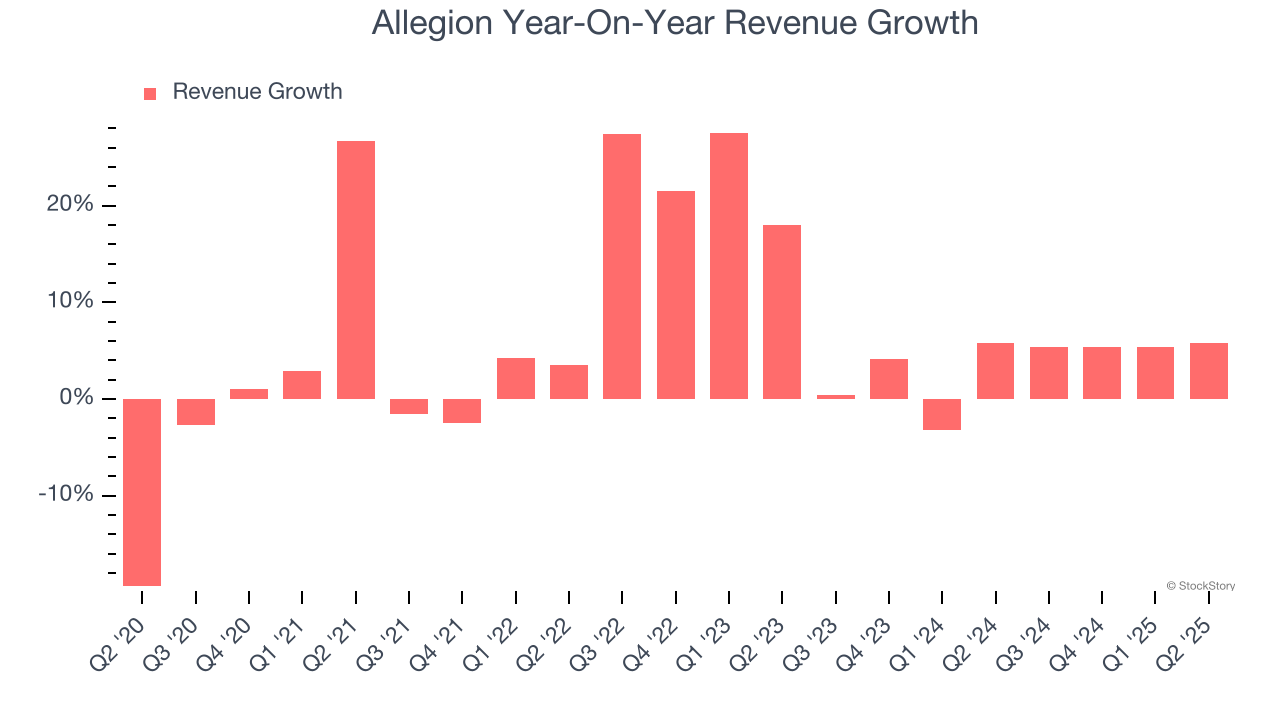
We can better understand the company’s sales dynamics by analyzing its organic revenue, which strips out one-time events like acquisitions and currency fluctuations that don’t accurately reflect its fundamentals. Over the last two years, Allegion’s organic revenue averaged 2.2% year-on-year growth. Because this number aligns with its normal revenue growth, we can see the company’s core operations (not acquisitions and divestitures) drove most of its results. 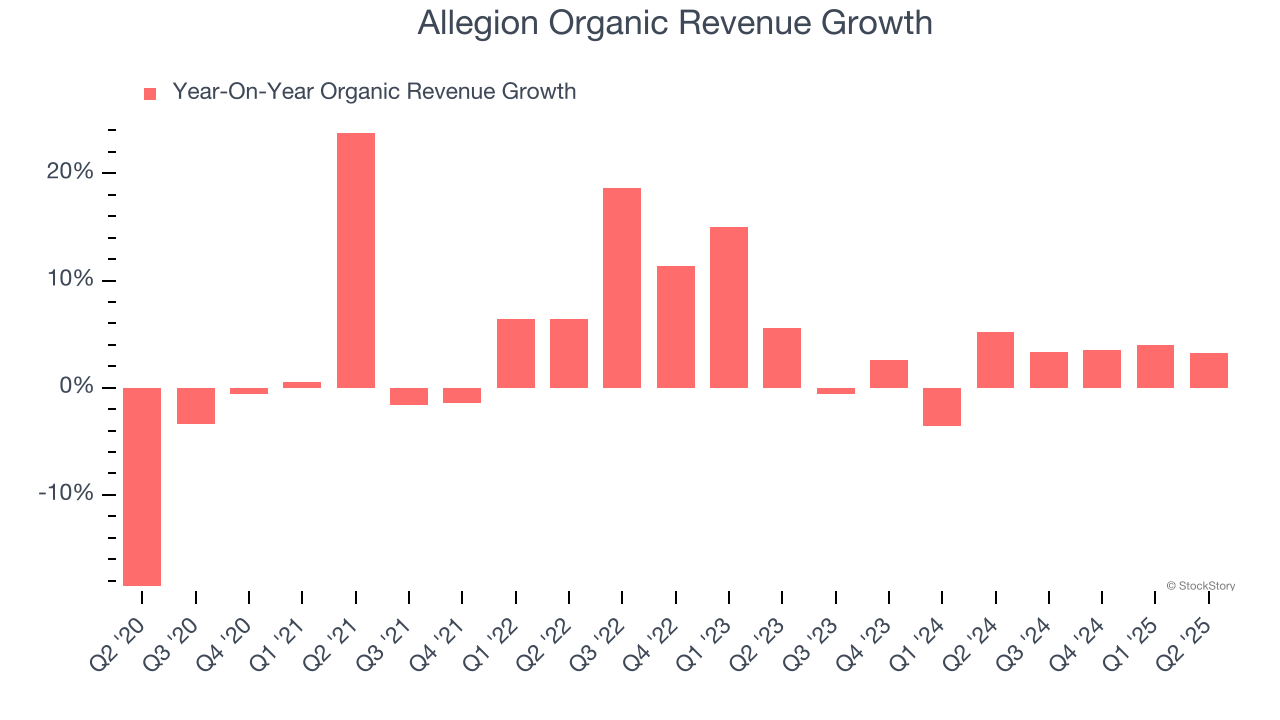
This quarter, Allegion reported year-on-year revenue growth of 5.8%, and its $1.02 billion of revenue exceeded Wall Street’s estimates by 1.5%.
Looking ahead, sell-side analysts expect revenue to grow 4.2% over the next 12 months, similar to its two-year rate. This projection is underwhelming and implies its newer products and services will not lead to better top-line performance yet.
Here at StockStory, we certainly understand the potential of thematic investing. Diverse winners from Microsoft (MSFT) to Alphabet (GOOG), Coca-Cola (KO) to Monster Beverage (MNST) could all have been identified as promising growth stories with a megatrend driving the growth. So, in that spirit, we’ve identified a relatively under-the-radar profitable growth stock benefiting from the rise of AI, available to you FREE via this link.
Operating Margin
Allegion has been a well-oiled machine over the last five years. It demonstrated elite profitability for an industrials business, boasting an average operating margin of 19.4%. This result isn’t surprising as its high gross margin gives it a favorable starting point.
Looking at the trend in its profitability, Allegion’s operating margin rose by 1.9 percentage points over the last five years, as its sales growth gave it operating leverage.
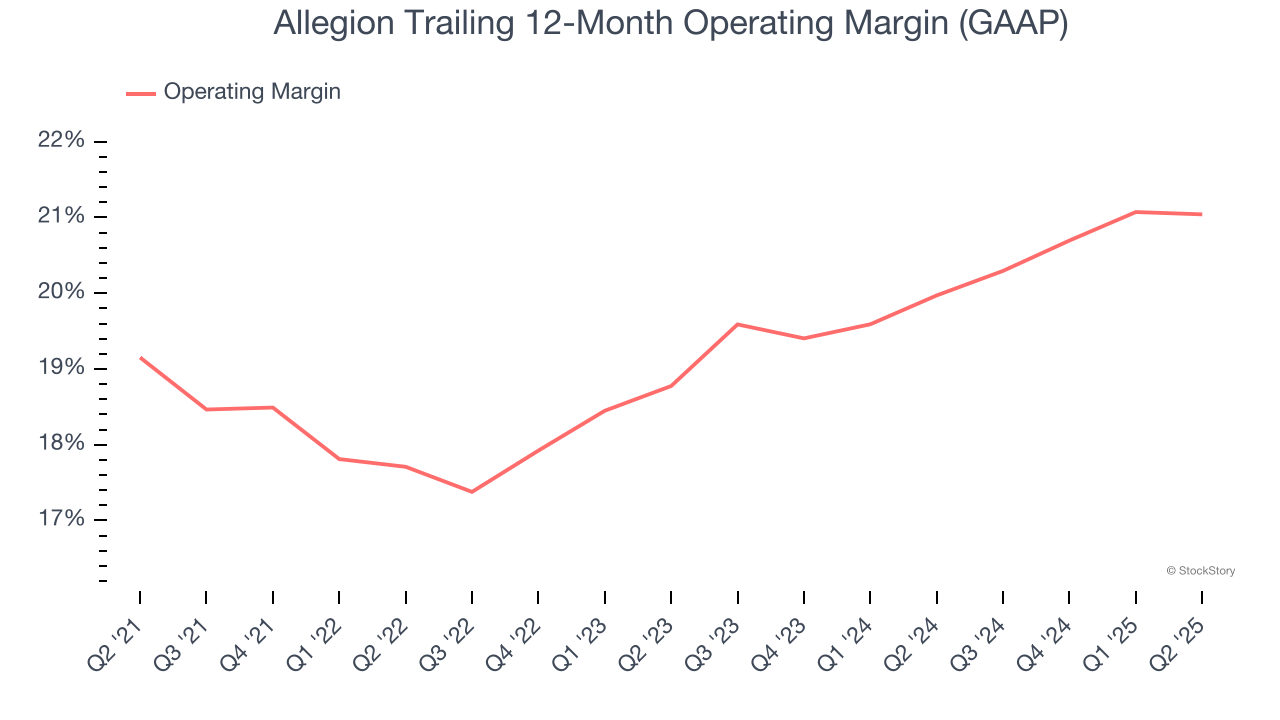
This quarter, Allegion generated an operating margin profit margin of 21.5%, in line with the same quarter last year. This indicates the company’s cost structure has recently been stable.
Earnings Per Share
We track the long-term change in earnings per share (EPS) for the same reason as long-term revenue growth. Compared to revenue, however, EPS highlights whether a company’s growth is profitable.
Allegion’s EPS grew at a solid 11% compounded annual growth rate over the last five years, higher than its 7.2% annualized revenue growth. This tells us the company became more profitable on a per-share basis as it expanded.
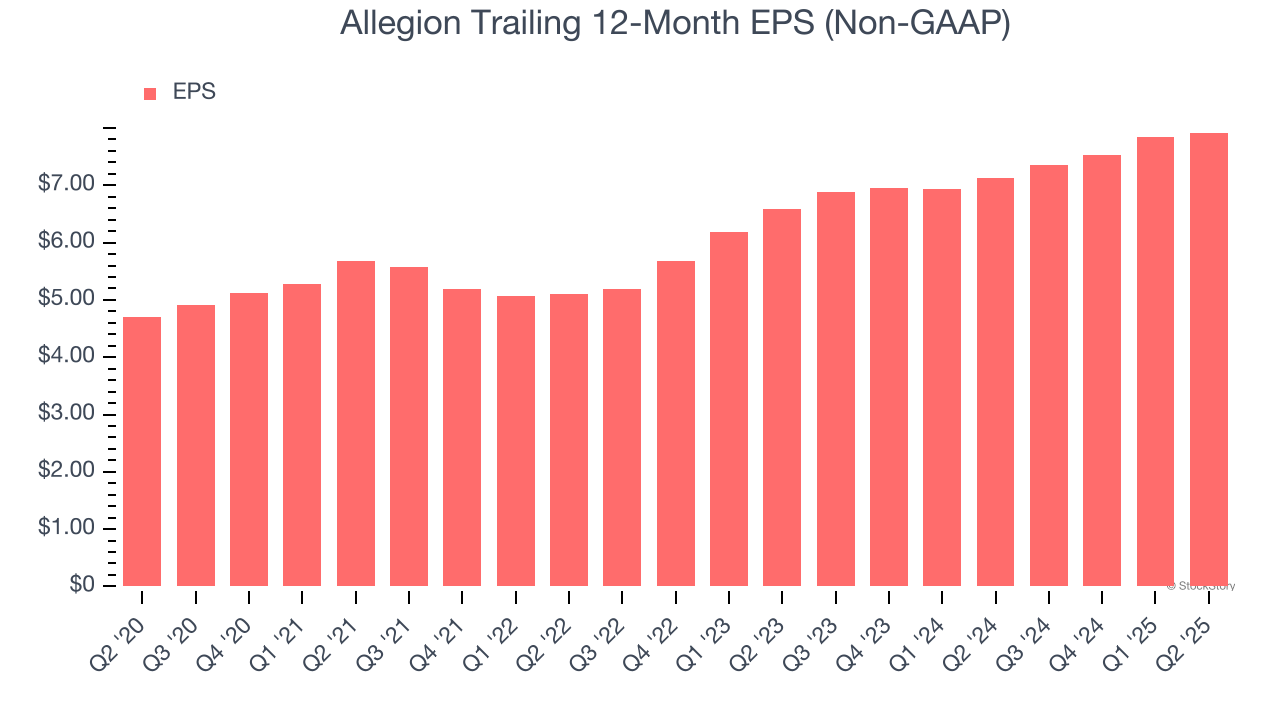
We can take a deeper look into Allegion’s earnings quality to better understand the drivers of its performance. As we mentioned earlier, Allegion’s operating margin was flat this quarter but expanded by 1.9 percentage points over the last five years. On top of that, its share count shrank by 6.8%. These are positive signs for shareholders because improving profitability and share buybacks turbocharge EPS growth relative to revenue growth. 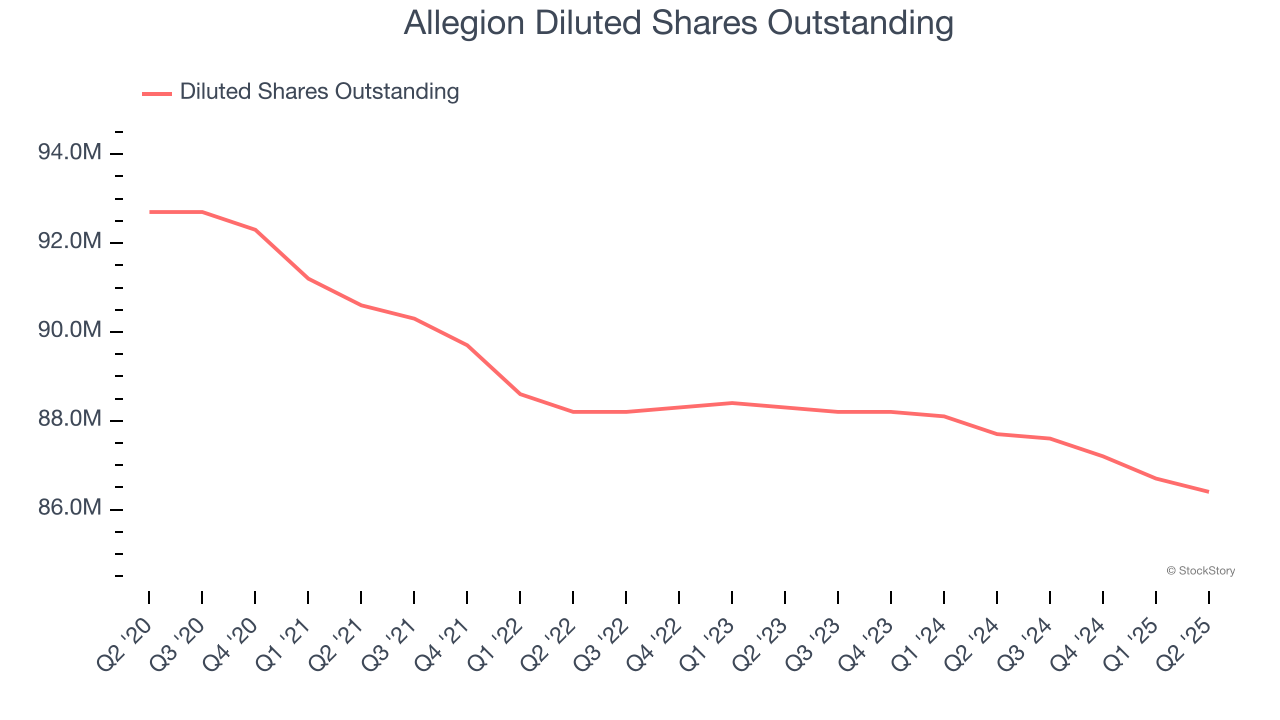
Like with revenue, we analyze EPS over a more recent period because it can provide insight into an emerging theme or development for the business.
For Allegion, its two-year annual EPS growth of 9.7% was lower than its five-year trend. We hope its growth can accelerate in the future.
In Q2, Allegion reported EPS at $2.04, up from $1.96 in the same quarter last year. This print beat analysts’ estimates by 2.7%. Over the next 12 months, Wall Street expects Allegion’s full-year EPS of $7.92 to grow 1.9%.
Key Takeaways from Allegion’s Q2 Results
It was great to see Allegion’s full-year EPS guidance top analysts’ expectations. We were also happy its revenue narrowly outperformed Wall Street’s estimates. Overall, we think this was a decent quarter with some key metrics above expectations. The stock traded up 1% to $156 immediately after reporting.
Indeed, Allegion had a rock-solid quarterly earnings result, but is this stock a good investment here? If you’re making that decision, you should consider the bigger picture of valuation, business qualities, as well as the latest earnings. We cover that in our actionable full research report which you can read here, it’s free.