
Socially responsible bank Amalgamated Financial (NASDAQ: AMAL) met Wall Street’s revenue expectations in Q2 CY2025, with sales up 4.8% year on year to $82.18 million. Its non-GAAP profit of $0.88 per share was 1.1% above analysts’ consensus estimates.
Is now the time to buy Amalgamated Financial? Find out by accessing our full research report, it’s free.
Amalgamated Financial (AMAL) Q2 CY2025 Highlights:
- Net Interest Income: $72.91 million vs analyst estimates of $73.09 million (5.4% year-on-year growth, in line)
- Net Interest Margin: 3.6% vs analyst estimates of 3.6% (9 basis point year-on-year increase, 5.5 bps miss)
- Revenue: $82.18 million vs analyst estimates of $82.52 million (4.8% year-on-year growth, in line)
- Efficiency Ratio: 50.1% vs analyst estimates of 51.3% (1.1 percentage point beat)
- Adjusted EPS: $0.88 vs analyst estimates of $0.87 (1.1% beat)
- Market Capitalization: $1.02 billion
Priscilla Sims Brown, President and Chief Executive Officer, commented, “We are achieving our results because our banking model is flexible. We have many levers we can pull to drive performance and that creates reliability and predictability for our shareholders, customers, and employees.”
Company Overview
Founded in 1923 by labor unions seeking a financial institution aligned with worker values, Amalgamated Financial (NASDAQGM:AMAL) operates a values-oriented bank that provides commercial banking, trust services, and investment management to socially responsible organizations and individuals.
Sales Growth
Two primary revenue streams drive bank earnings. While net interest income, which is earned by charging higher rates on loans than paid on deposits, forms the foundation, fee-based services across banking, credit, wealth management, and trading operations provide additional income.
Luckily, Amalgamated Financial’s revenue grew at an impressive 9.3% compounded annual growth rate over the last five years. Its growth surpassed the average bank company and shows its offerings resonate with customers, a great starting point for our analysis.
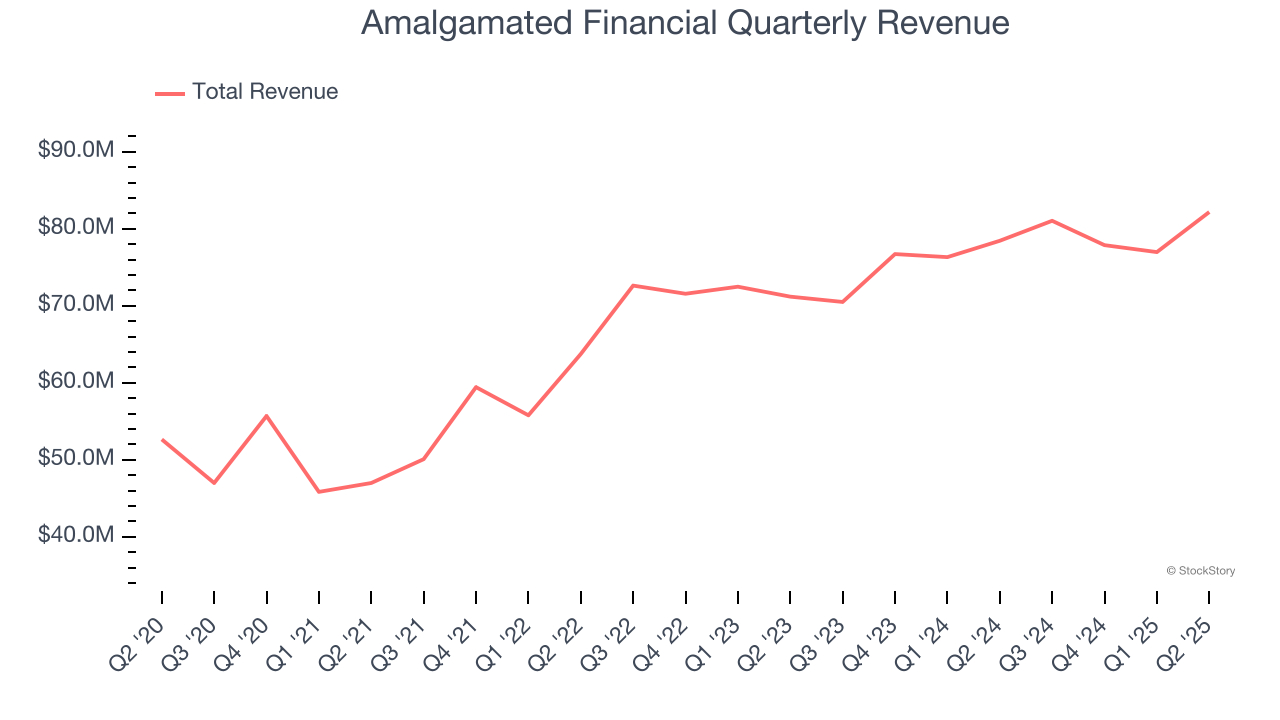
Long-term growth is the most important, but within financials, a half-decade historical view may miss recent interest rate changes and market returns. Amalgamated Financial’s annualized revenue growth of 5.1% over the last two years is below its five-year trend, but we still think the results were respectable. 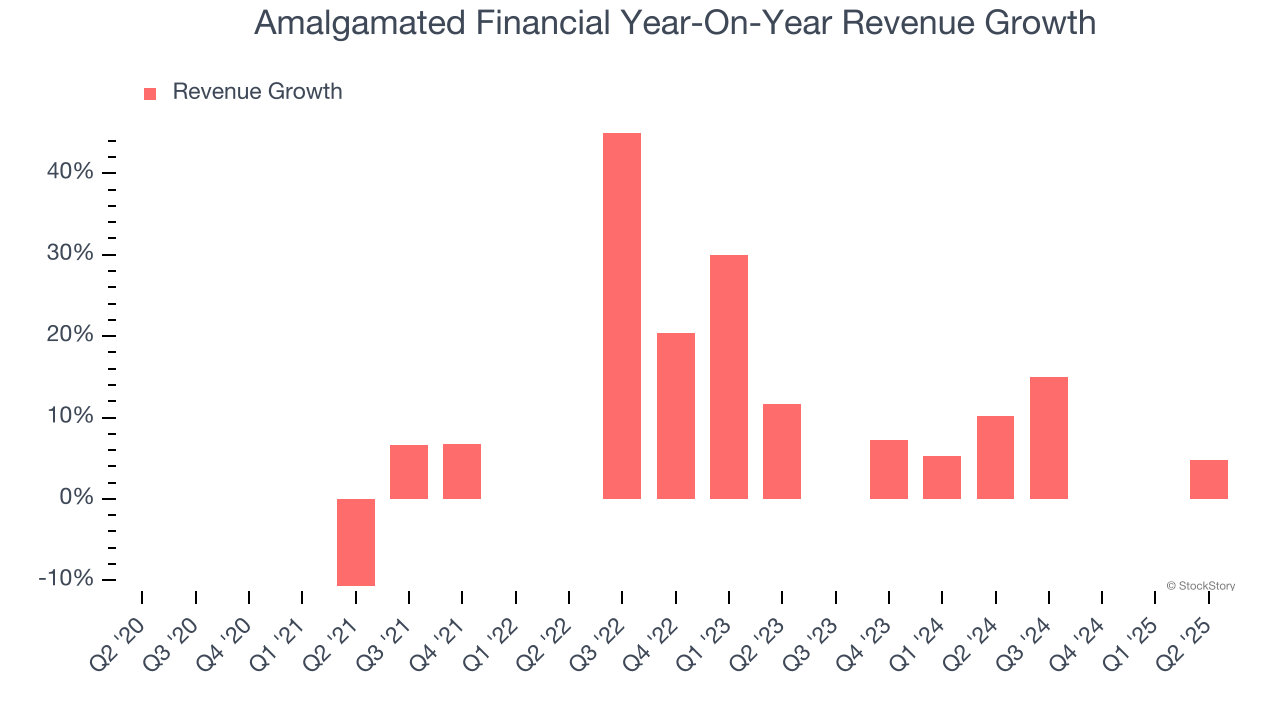 Note: Quarters not shown were determined to be outliers, impacted by outsized investment gains/losses that are not indicative of the recurring fundamentals of the business.
This quarter, Amalgamated Financial grew its revenue by 4.8% year on year, and its $82.18 million of revenue was in line with Wall Street’s estimates.
Net interest income made up 89.4% of the company’s total revenue during the last five years, meaning Amalgamated Financial barely relies on non-interest income to drive its overall growth.
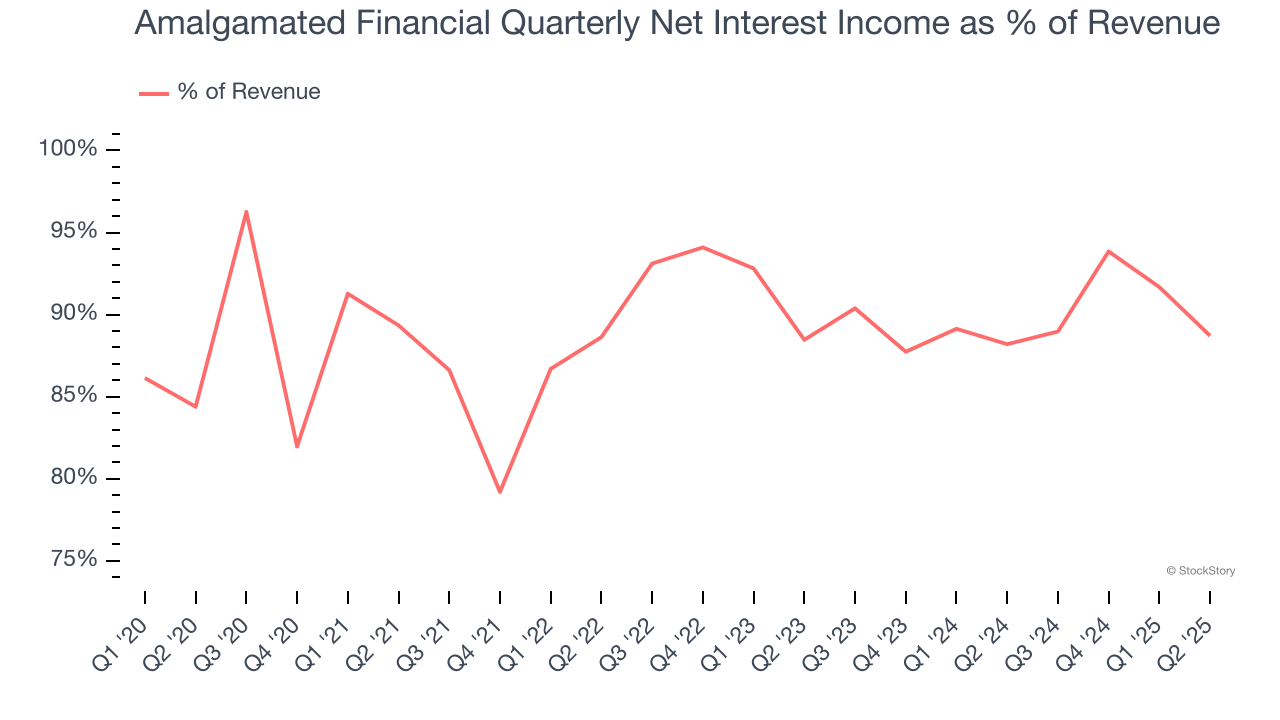
While banks generate revenue from multiple sources, investors view net interest income as the cornerstone - its predictable, recurring characteristics stand in sharp contrast to the volatility of non-interest income.
Here at StockStory, we certainly understand the potential of thematic investing. Diverse winners from Microsoft (MSFT) to Alphabet (GOOG), Coca-Cola (KO) to Monster Beverage (MNST) could all have been identified as promising growth stories with a megatrend driving the growth. So, in that spirit, we’ve identified a relatively under-the-radar profitable growth stock benefiting from the rise of AI, available to you FREE via this link.
Tangible Book Value Per Share (TBVPS)
The balance sheet drives banking profitability since earnings flow from the spread between borrowing and lending rates. As such, valuations for these companies concentrate on capital strength and sustainable equity accumulation potential.
Because of this, tangible book value per share (TBVPS) emerges as the critical performance benchmark. By excluding intangible assets with uncertain liquidation values, this metric captures real, liquid net worth per share. EPS can become murky due to acquisition impacts or accounting flexibility around loan provisions, and TBVPS resists financial engineering manipulation.
Amalgamated Financial’s TBVPS grew at an exceptional 9.3% annual clip over the last five years. TBVPS growth has also accelerated recently, growing by 20.4% annually over the last two years from $16.78 to $24.33 per share.
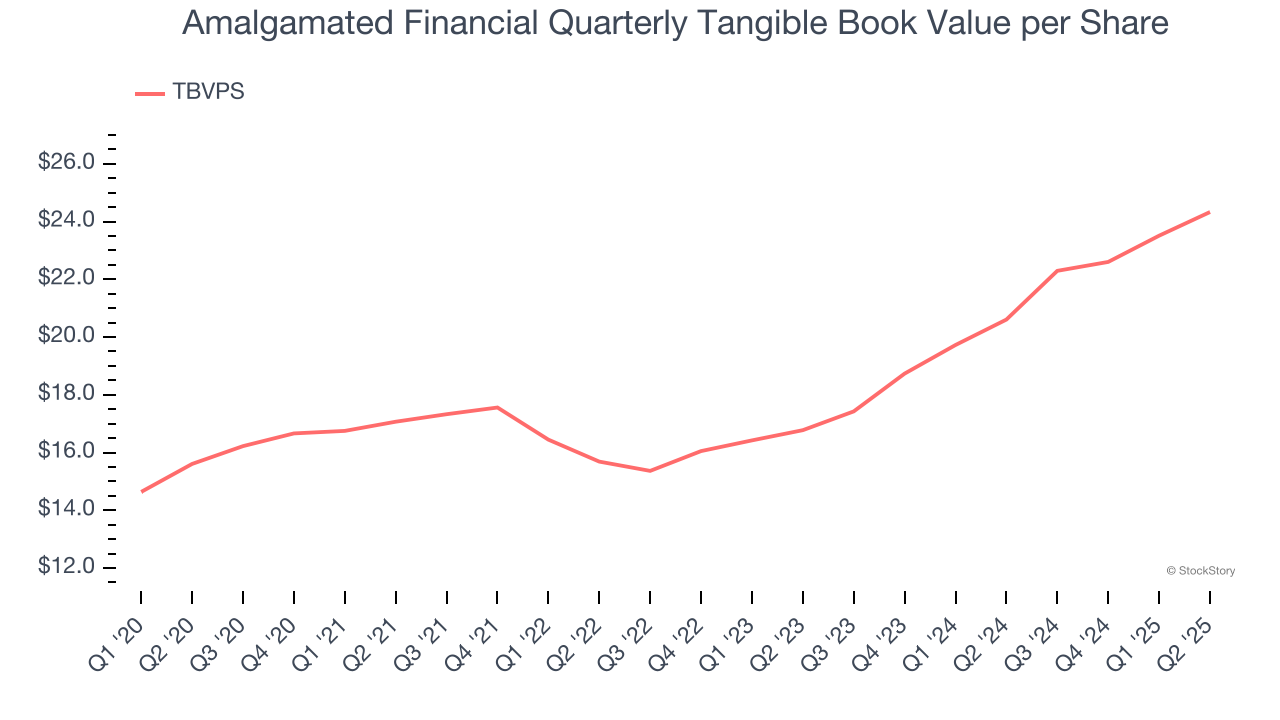
Over the next 12 months, Consensus estimates call for Amalgamated Financial’s TBVPS to grow by 14.7% to $27.90, top-notch growth rate.
Key Takeaways from Amalgamated Financial’s Q2 Results
Although net interest income and revenue were in line, efficiency ratio and EPS beat slightly. Overall, this was a fine quarter with no major surprises. The stock remained flat at $33.35 immediately following the results.
Is Amalgamated Financial an attractive investment opportunity at the current price? If you’re making that decision, you should consider the bigger picture of valuation, business qualities, as well as the latest earnings. We cover that in our actionable full research report which you can read here, it’s free.