
Business advisory firm FTI Consulting (NYSE: FCN) reported Q2 CY2025 results exceeding the market’s revenue expectations, but sales were flat year on year at $943.7 million. The company’s full-year revenue guidance of $3.71 billion at the midpoint came in 1.1% above analysts’ estimates. Its GAAP profit of $2.13 per share was 26.8% above analysts’ consensus estimates.
Is now the time to buy FTI Consulting? Find out by accessing our full research report, it’s free.
FTI Consulting (FCN) Q2 CY2025 Highlights:
- Revenue: $943.7 million vs analyst estimates of $912.3 million (flat year on year, 3.4% beat)
- EPS (GAAP): $2.13 vs analyst estimates of $1.68 (26.8% beat)
- Adjusted EBITDA: $111.6 million vs analyst estimates of $96.47 million (11.8% margin, 15.7% beat)
- Operating Margin: 10.5%, in line with the same quarter last year
- Free Cash Flow Margin: 4.1%, down from 13.2% in the same quarter last year
- Market Capitalization: $5.64 billion
Company Overview
With a team of experts deployed across 30+ countries to tackle complex business challenges, FTI Consulting (NYSE: FCN) is a global business advisory firm that helps organizations manage change, mitigate risk, and resolve disputes across financial, legal, operational, and regulatory matters.
Revenue Growth
Reviewing a company’s long-term sales performance reveals insights into its quality. Any business can have short-term success, but a top-tier one grows for years.
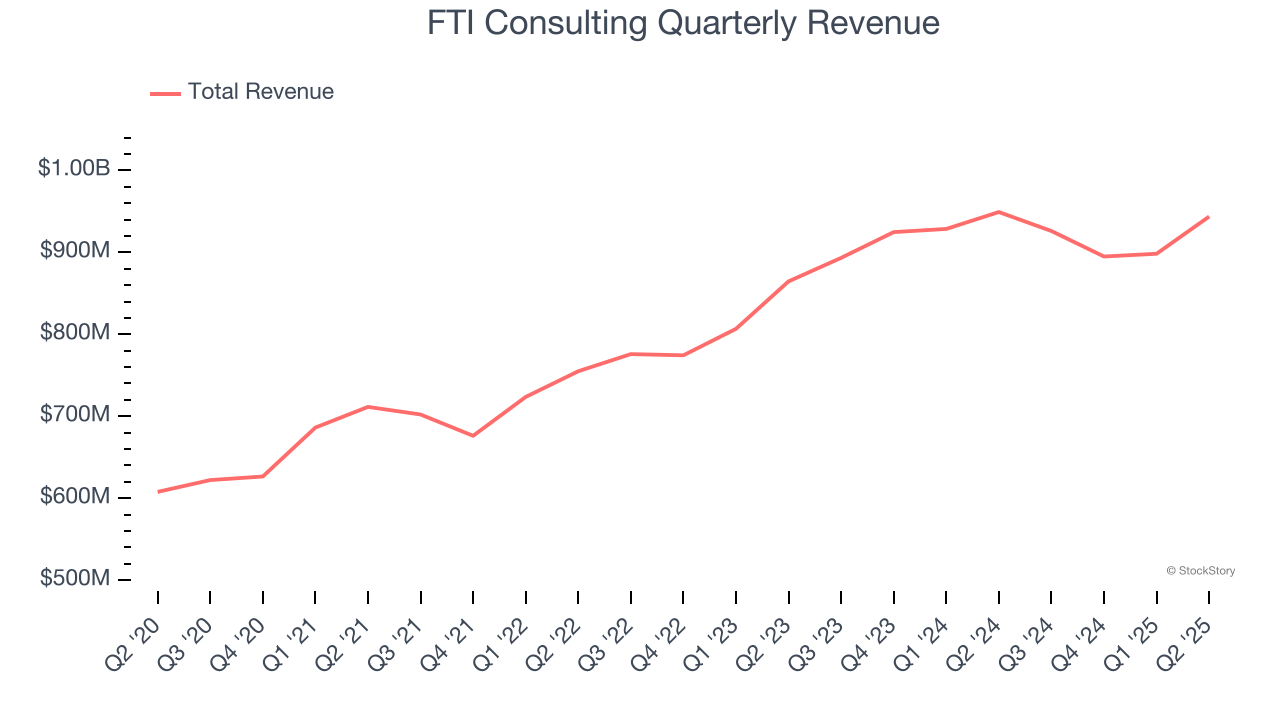
With $3.66 billion in revenue over the past 12 months, FTI Consulting is a mid-sized business services company, which sometimes brings disadvantages compared to larger competitors benefiting from better economies of scale. On the bright side, it can still flex high growth rates because it’s working from a smaller revenue base.
As you can see below, FTI Consulting’s 8.8% annualized revenue growth over the last five years was solid. This shows it had high demand, a useful starting point for our analysis.
We at StockStory place the most emphasis on long-term growth, but within business services, a half-decade historical view may miss recent innovations or disruptive industry trends. FTI Consulting’s annualized revenue growth of 6.6% over the last two years is below its five-year trend, but we still think the results were respectable. 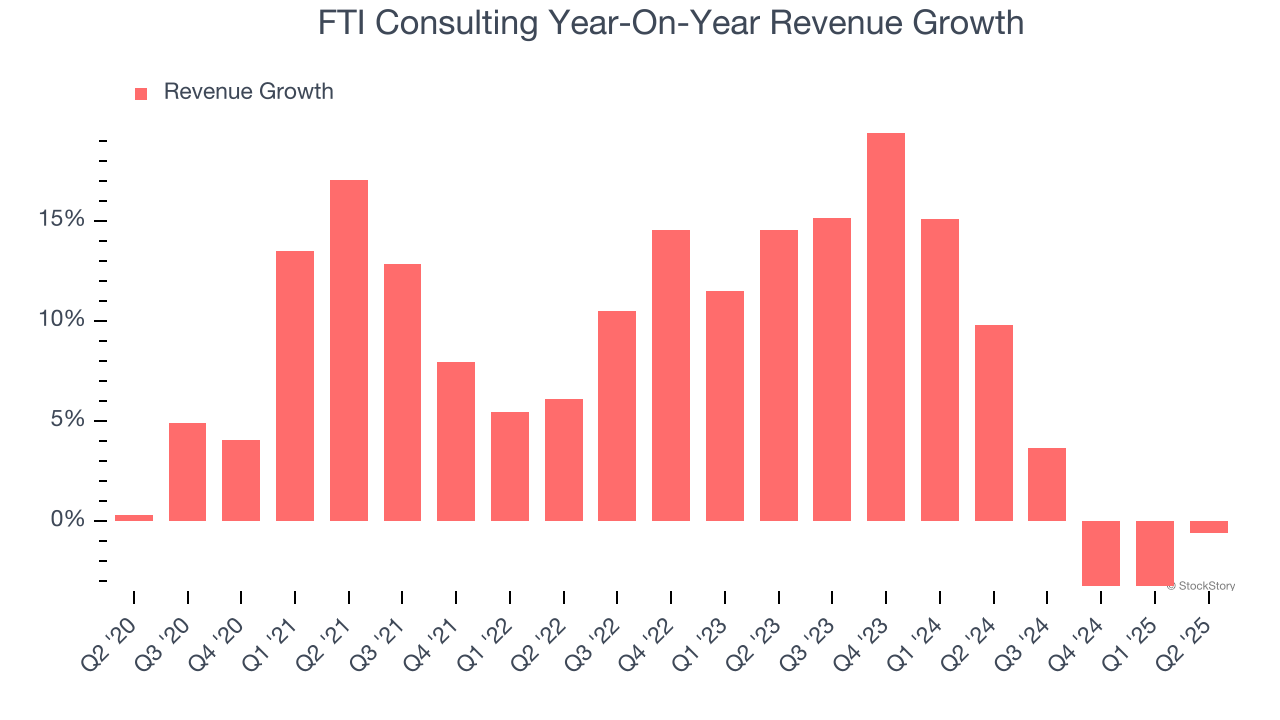
This quarter, FTI Consulting’s $943.7 million of revenue was flat year on year but beat Wall Street’s estimates by 3.4%.
Looking ahead, sell-side analysts expect revenue to grow 3.2% over the next 12 months, a deceleration versus the last two years. This projection doesn't excite us and suggests its products and services will see some demand headwinds.
Software is eating the world and there is virtually no industry left that has been untouched by it. That drives increasing demand for tools helping software developers do their jobs, whether it be monitoring critical cloud infrastructure, integrating audio and video functionality, or ensuring smooth content streaming. Click here to access a free report on our 3 favorite stocks to play this generational megatrend.
Operating Margin
Operating margin is one of the best measures of profitability because it tells us how much money a company takes home after subtracting all core expenses, like marketing and R&D.
FTI Consulting has done a decent job managing its cost base over the last five years. The company has produced an average operating margin of 10.3%, higher than the broader business services sector.
Analyzing the trend in its profitability, FTI Consulting’s operating margin decreased by 3.2 percentage points over the last five years. This raises questions about the company’s expense base because its revenue growth should have given it leverage on its fixed costs, resulting in better economies of scale and profitability.
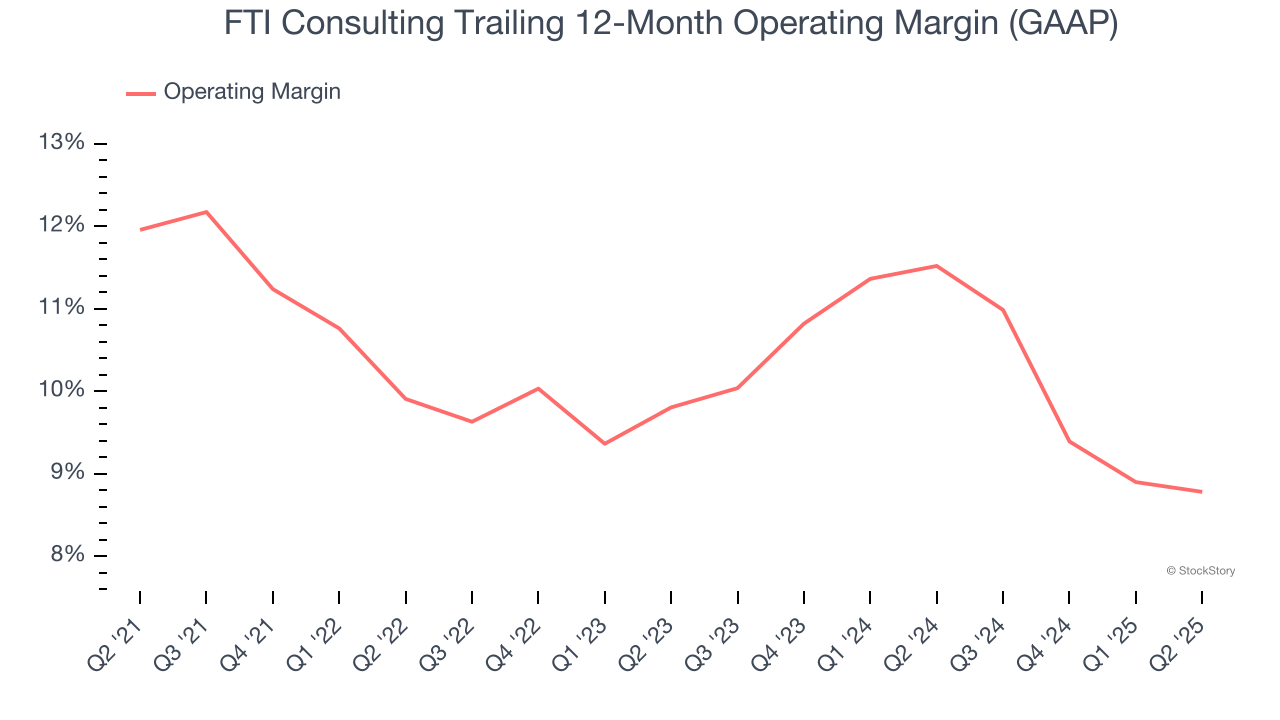
This quarter, FTI Consulting generated an operating margin profit margin of 10.5%, in line with the same quarter last year. This indicates the company’s overall cost structure has been relatively stable.
Earnings Per Share
Revenue trends explain a company’s historical growth, but the long-term change in earnings per share (EPS) points to the profitability of that growth – for example, a company could inflate its sales through excessive spending on advertising and promotions.
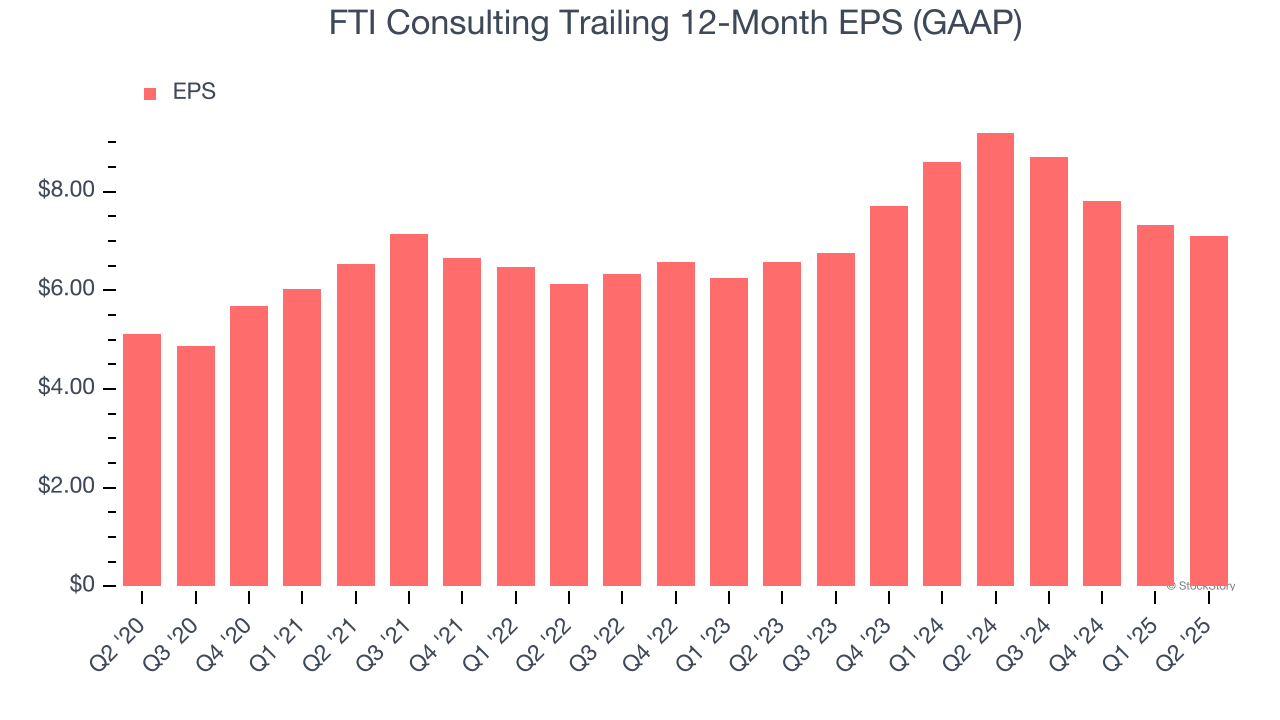
FTI Consulting’s unimpressive 6.8% annual EPS growth over the last five years aligns with its revenue performance. This tells us it maintained its per-share profitability as it expanded.
Like with revenue, we analyze EPS over a shorter period to see if we are missing a change in the business.
For FTI Consulting, its two-year annual EPS growth of 4% was lower than its five-year trend. We hope its growth can accelerate in the future.
In Q2, FTI Consulting reported EPS at $2.13, down from $2.34 in the same quarter last year. Despite falling year on year, this print easily cleared analysts’ estimates. We also like to analyze expected EPS growth based on Wall Street analysts’ consensus projections, but there is insufficient data.
Key Takeaways from FTI Consulting’s Q2 Results
We were impressed by how significantly FTI Consulting blew past analysts’ EPS and EBITDA expectations this quarter. We were also glad its revenue outperformed Wall Street’s estimates. Zooming out, we think this quarter featured some important positives. The stock traded up 3% to $172.60 immediately following the results.
FTI Consulting had an encouraging quarter, but one earnings result doesn’t necessarily make the stock a buy. Let’s see if this is a good investment. When making that decision, it’s important to consider its valuation, business qualities, as well as what has happened in the latest quarter. We cover that in our actionable full research report which you can read here, it’s free.