Boat and marine products retailer MarineMax (NYSE: HZO) missed Wall Street’s revenue expectations in Q2 CY2025, with sales falling 13.3% year on year to $657.2 million. Its non-GAAP profit of $0.49 per share was 58.4% below analysts’ consensus estimates.
Is now the time to buy MarineMax? Find out by accessing our full research report, it’s free.
MarineMax (HZO) Q2 CY2025 Highlights:
- Revenue: $657.2 million vs analyst estimates of $735 million (13.3% year-on-year decline, 10.6% miss)
- Adjusted EPS: $0.49 vs analyst expectations of $1.18 (58.4% miss)
- Adjusted EBITDA: $35.54 million vs analyst estimates of $60.58 million (5.4% margin, 41.3% miss)
- Management lowered its full-year Adjusted EPS guidance to $0.70 at the midpoint, a 63.2% decrease
- EBITDA guidance for the full year is $112.5 million at the midpoint, below analyst estimates of $153.2 million
- Operating Margin: -6.3%, down from 8.1% in the same quarter last year
- Locations: 70 at quarter end, down from 77 in the same quarter last year
- Same-Store Sales fell 9% year on year (4% in the same quarter last year)
- Market Capitalization: $586.7 million
“A combination of ongoing economic uncertainty, evolving trade policies and geopolitical tensions contributed to weak retail demand across the recreational marine industry in the June quarter,” said Brett McGill, Chief Executive Officer and President of MarineMax.
Company Overview
Appropriately headquartered in Clearwater, Florida, MarineMax (NYSE: HZO) sells boats, yachts, and other marine products.
Revenue Growth
Examining a company’s long-term performance can provide clues about its quality. Any business can put up a good quarter or two, but the best consistently grow over the long haul.
With $2.32 billion in revenue over the past 12 months, MarineMax is a small retailer, which sometimes brings disadvantages compared to larger competitors benefiting from economies of scale and negotiating leverage with suppliers. On the bright side, it can grow faster because it has more white space to build new stores.
As you can see below, MarineMax grew its sales at a decent 11% compounded annual growth rate over the last six years (we compare to 2019 to normalize for COVID-19 impacts) despite closing stores.
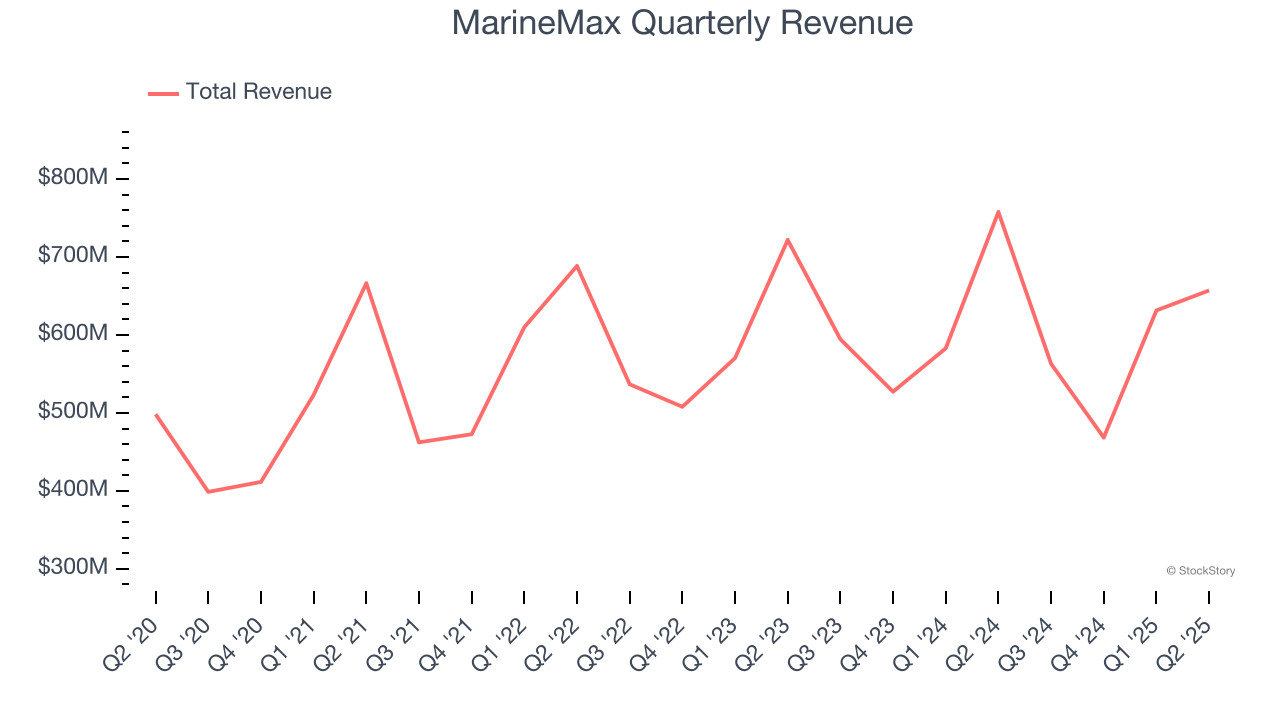
This quarter, MarineMax missed Wall Street’s estimates and reported a rather uninspiring 13.3% year-on-year revenue decline, generating $657.2 million of revenue.
Looking ahead, sell-side analysts expect revenue to grow 6.8% over the next 12 months, a deceleration versus the last six years. Still, this projection is admirable and indicates the market sees success for its products.
Today’s young investors won’t have read the timeless lessons in Gorilla Game: Picking Winners In High Technology because it was written more than 20 years ago when Microsoft and Apple were first establishing their supremacy. But if we apply the same principles, then enterprise software stocks leveraging their own generative AI capabilities may well be the Gorillas of the future. So, in that spirit, we are excited to present our Special Free Report on a profitable, fast-growing enterprise software stock that is already riding the automation wave and looking to catch the generative AI next.
Store Performance
Number of Stores
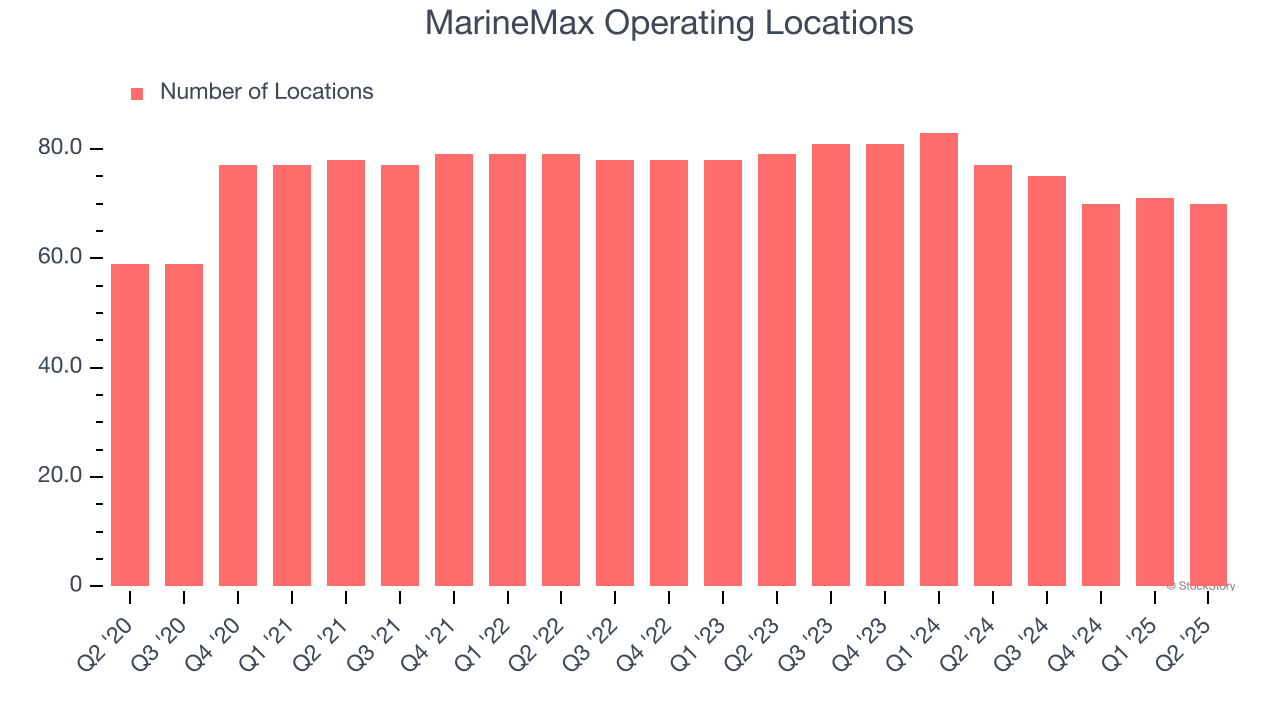
MarineMax listed 70 locations in the latest quarter and has generally closed its stores over the last two years, averaging 4.1% annual declines.
When a retailer shutters stores, it usually means that brick-and-mortar demand is less than supply, and it is responding by closing underperforming locations to improve profitability.
Same-Store Sales
A company's store base only paints one part of the picture. When demand is high, it makes sense to open more. But when demand is low, it’s prudent to close some locations and use the money in other ways. Same-store sales gives us insight into this topic because it measures organic growth for a retailer's e-commerce platform and brick-and-mortar shops that have existed for at least a year.
MarineMax’s demand within its existing locations has barely increased over the last two years as its same-store sales were flat. This performance isn’t ideal, and MarineMax is attempting to boost same-store sales by closing stores (fewer locations sometimes lead to higher same-store sales).
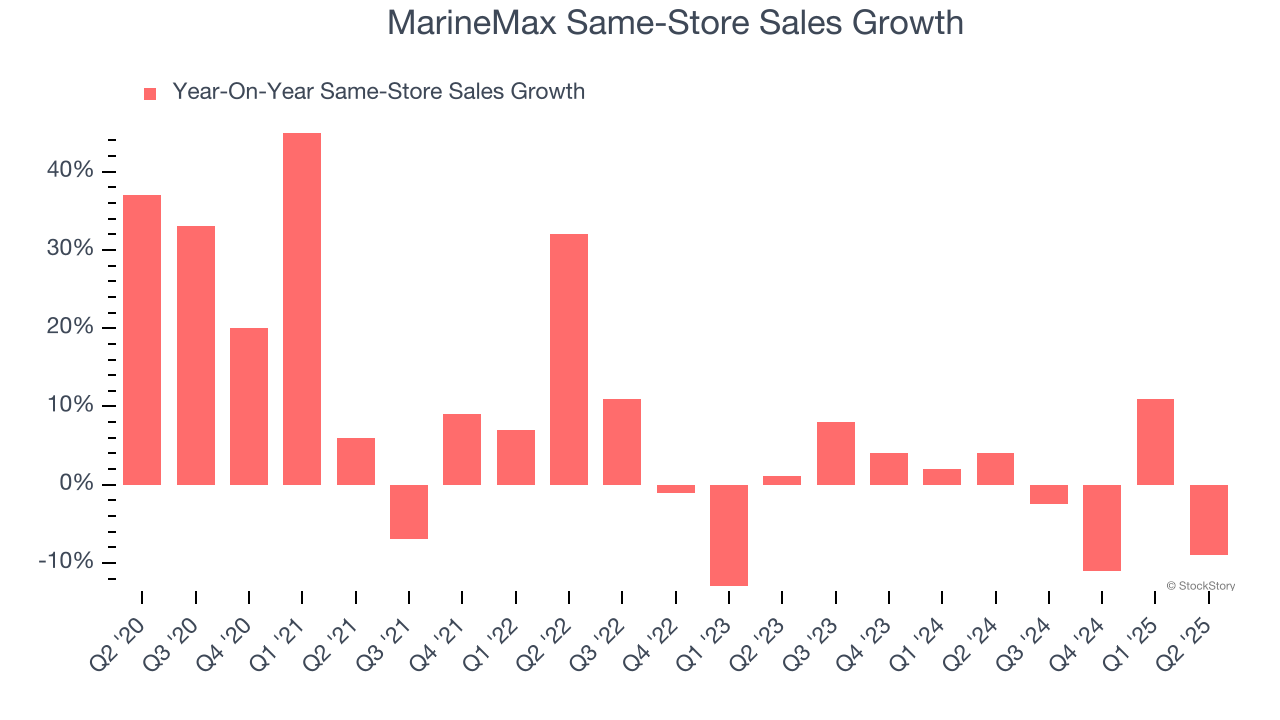
In the latest quarter, MarineMax’s same-store sales fell by 9% year on year. This decline was a reversal from its historical levels.
Key Takeaways from MarineMax’s Q2 Results
We struggled to find many positives in these results as it missed badly across all key metrics and lowered its full-year EPS and EBITDA guidance. Overall, this quarter could have been better. The stock traded down 22.1% to $21.31 immediately after reporting.
The latest quarter from MarineMax’s wasn’t that good. One earnings report doesn’t define a company’s quality, though, so let’s explore whether the stock is a buy at the current price. If you’re making that decision, you should consider the bigger picture of valuation, business qualities, as well as the latest earnings. We cover that in our actionable full research report which you can read here, it’s free.