
Financial services company The Bancorp (NASDAQ: TBBK) missed Wall Street’s revenue expectations in Q2 CY2025, but sales rose 10.8% year on year to $138 million. Its GAAP profit of $1.27 per share was 0.8% below analysts’ consensus estimates.
Is now the time to buy The Bancorp? Find out by accessing our full research report, it’s free.
The Bancorp (TBBK) Q2 CY2025 Highlights:
- Net Interest Income: $97.49 million vs analyst estimates of $96.4 million (3.9% year-on-year growth, 1.1% beat)
- Net Interest Margin: 4.4% vs analyst estimates of 4.3% (53 basis point year-on-year decrease, 16 bps beat)
- Revenue: $138 million vs analyst estimates of $193.3 million (10.8% year-on-year growth, 28.6% miss)
- Efficiency Ratio: 41% vs analyst estimates of 27.7% (13.3 percentage point miss)
- EPS (GAAP): $1.27 vs analyst expectations of $1.28 (0.8% miss)
- Market Capitalization: $3.25 billion
“The Bancorp had another quarter of Fintech growth and momentum,” said Damian Kozlowski, CEO of The Bancorp.
Company Overview
Operating behind the scenes of many popular fintech apps and prepaid cards you might use daily, The Bancorp (NASDAQ: TBBK) is a bank holding company that specializes in providing banking services to fintech companies and offering specialty lending products.
Sales Growth
Two primary revenue streams drive bank earnings. While net interest income, which is earned by charging higher rates on loans than paid on deposits, forms the foundation, fee-based services across banking, credit, wealth management, and trading operations provide additional income.
Luckily, The Bancorp’s revenue grew at an incredible 19.2% compounded annual growth rate over the last five years. Its growth beat the average bank company and shows its offerings resonate with customers.
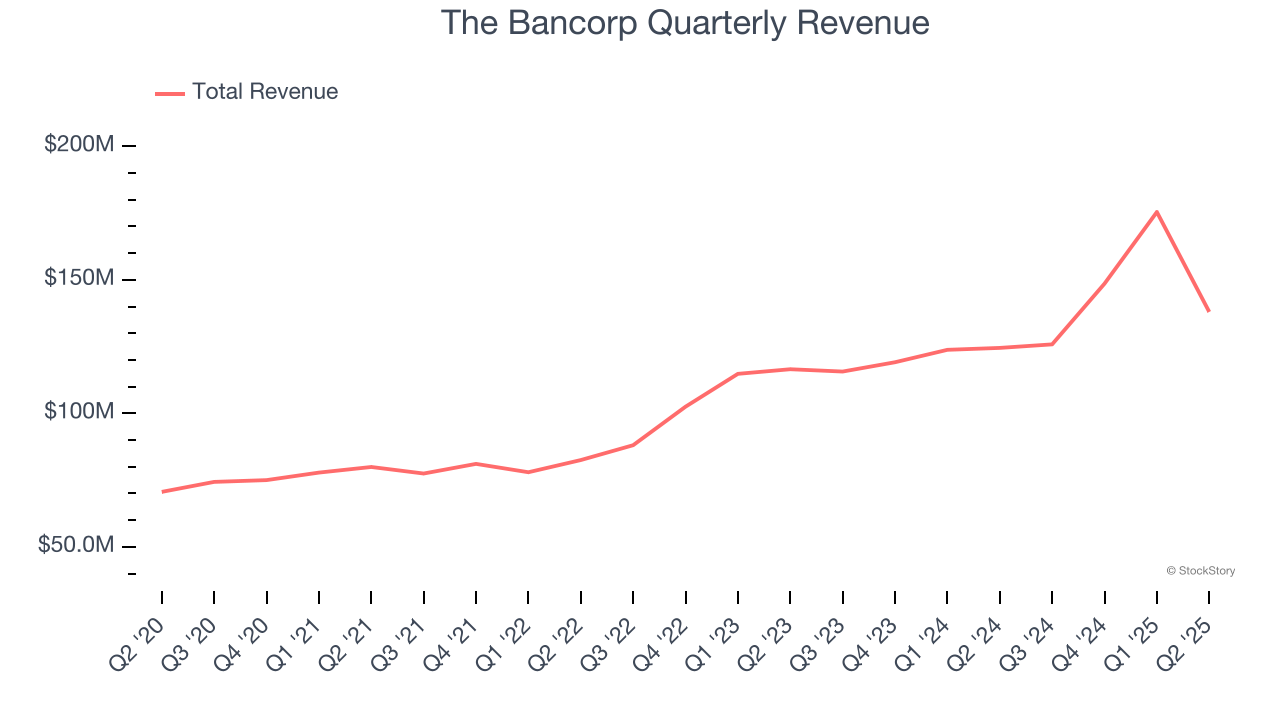
We at StockStory place the most emphasis on long-term growth, but within financials, a half-decade historical view may miss recent interest rate changes, market returns, and industry trends. The Bancorp’s annualized revenue growth of 18% over the last two years is below its five-year trend, but we still think the results suggest healthy demand.  Note: Quarters not shown were determined to be outliers, impacted by outsized investment gains/losses that are not indicative of the recurring fundamentals of the business.
This quarter, The Bancorp’s revenue grew by 10.8% year on year to $138 million but fell short of Wall Street’s estimates.
Net interest income made up 69.8% of the company’s total revenue during the last five years, meaning lending operations are The Bancorp’s largest source of revenue.
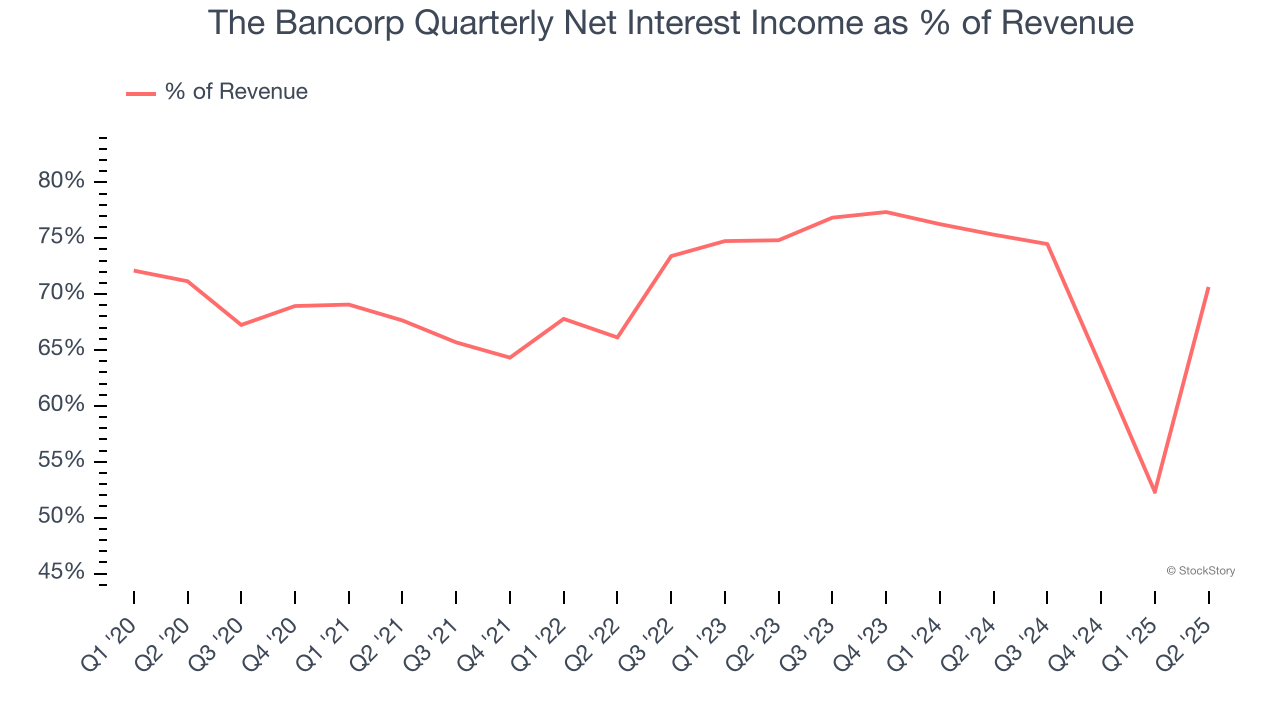
Our experience and research show the market cares primarily about a bank’s net interest income growth as non-interest income is considered a lower-quality and non-recurring revenue source.
Software is eating the world and there is virtually no industry left that has been untouched by it. That drives increasing demand for tools helping software developers do their jobs, whether it be monitoring critical cloud infrastructure, integrating audio and video functionality, or ensuring smooth content streaming. Click here to access a free report on our 3 favorite stocks to play this generational megatrend.
Tangible Book Value Per Share (TBVPS)
Banks operate as balance sheet businesses, with profits generated through borrowing and lending activities. Valuations reflect this reality, emphasizing balance sheet strength and long-term book value compounding ability.
This is why we consider tangible book value per share (TBVPS) the most important metric to track for banks. TBVPS represents the real, liquid net worth per share of a bank, excluding intangible assets that have debatable value upon liquidation. Traditional metrics like EPS are helpful but face distortion from M&A activity and loan loss accounting rules.
The Bancorp’s TBVPS grew at an incredible 15% annual clip over the last five years. TBVPS growth has also accelerated recently, growing by 16.5% annually over the last two years from $13.70 to $18.60 per share.
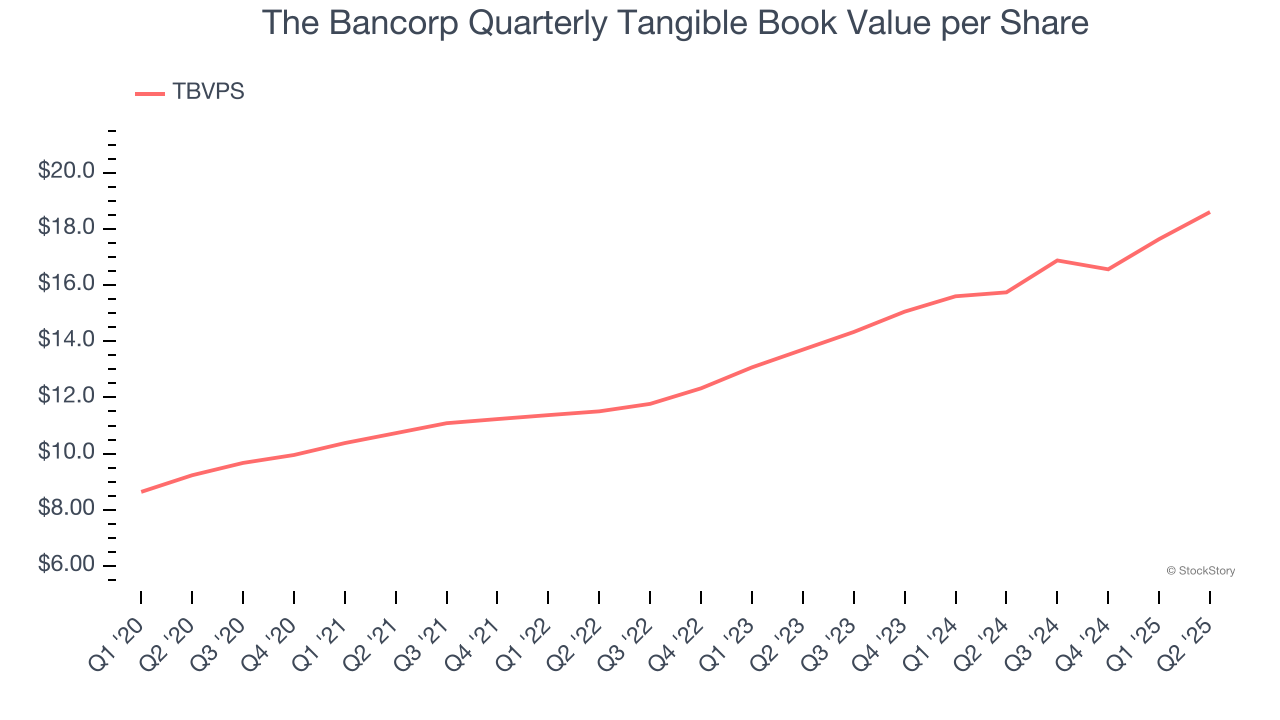
Over the next 12 months, Consensus estimates call for The Bancorp’s TBVPS to grow by 10.5% to $20.55, solid growth rate.
Key Takeaways from The Bancorp’s Q2 Results
It was encouraging to see The Bancorp beat analysts’ tangible book value per share expectations this quarter. We were also happy its net interest income and NIM outperformed Wall Street’s estimates. On the other hand, its revenue and EPS fell short of Wall Street’s estimates. Overall, this was a mixed quarter. The stock remained flat at $69.34 immediately after reporting.
The Bancorp underperformed this quarter, but does that create an opportunity to invest right now? We think that the latest quarter is only one piece of the longer-term business quality puzzle. Quality, when combined with valuation, can help determine if the stock is a buy. We cover that in our actionable full research report which you can read here, it’s free.