
Earnings results often indicate what direction a company will take in the months ahead. With Q1 behind us, let’s have a look at ESAB (NYSE: ESAB) and its peers.
Automation that increases efficiency and connected equipment that collects analyzable data have been trending, creating new demand. Some professional tools and equipment companies also provide software to accompany measurement or automated machinery, adding a stream of recurring revenues to their businesses. On the other hand, professional tools and equipment companies are at the whim of economic cycles. Consumer spending and interest rates, for example, can greatly impact the industrial production that drives demand for these companies’ offerings.
The 10 professional tools and equipment stocks we track reported a mixed Q1. As a group, revenues missed analysts’ consensus estimates by 3.2% while next quarter’s revenue guidance was 1.1% above.
Thankfully, share prices of the companies have been resilient as they are up 9.1% on average since the latest earnings results.
Best Q1: ESAB (NYSE: ESAB)
Having played a significant role in the construction of the iconic Sydney Opera House, ESAB (NYSE: ESAB) manufactures and sells welding and cutting equipment for numerous industries.
ESAB reported revenues of $678.1 million, down 1.7% year on year. This print exceeded analysts’ expectations by 2.2%. Overall, it was a very strong quarter for the company with a solid beat of analysts’ EBITDA estimates.
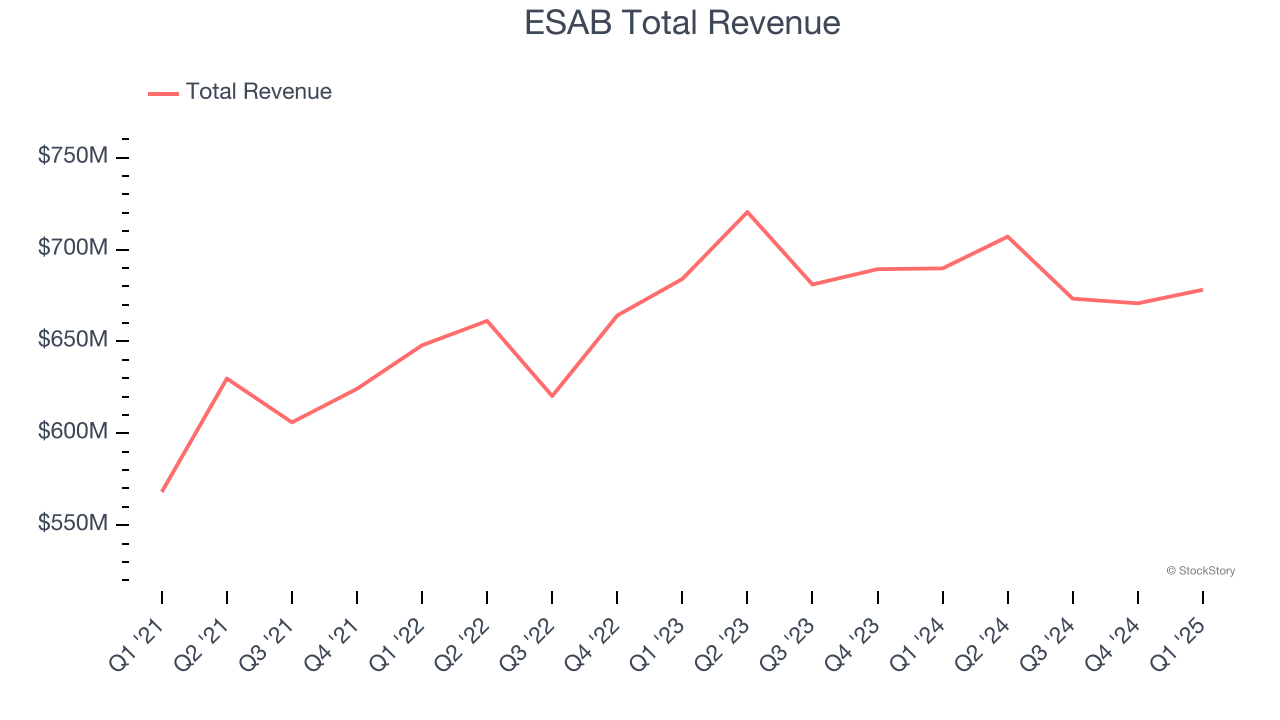
Interestingly, the stock is up 9.9% since reporting and currently trades at $132.07.
Is now the time to buy ESAB? Access our full analysis of the earnings results here, it’s free.
Kennametal (NYSE: KMT)
Involved in manufacturing hard tips of anti-tank projectiles in World War II, Kennametal (NYSE: KMT) is a provider of industrial materials and tools for various sectors.
Kennametal reported revenues of $486.4 million, down 5.7% year on year, in line with analysts’ expectations. The business had a very strong quarter with a solid beat of analysts’ EPS estimates and an impressive beat of analysts’ EBITDA estimates.
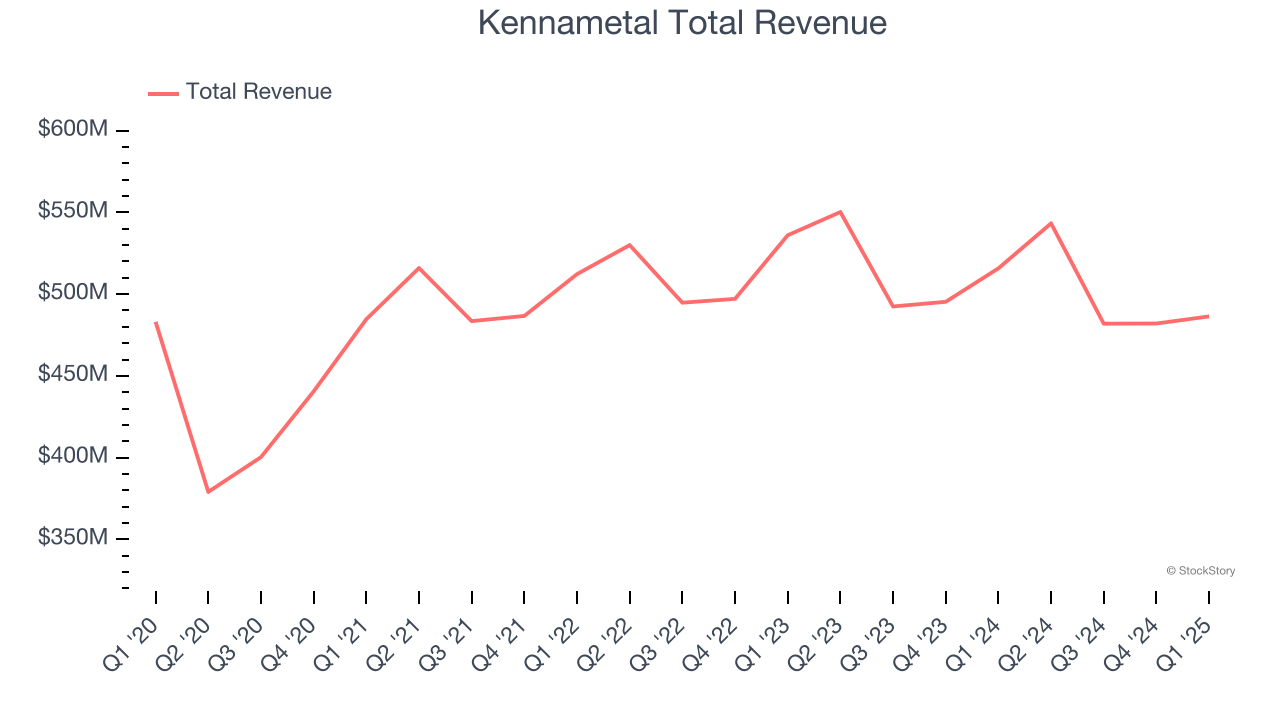
Kennametal achieved the highest full-year guidance raise among its peers. The market seems happy with the results as the stock is up 27.4% since reporting. It currently trades at $25.24.
Is now the time to buy Kennametal? Access our full analysis of the earnings results here, it’s free.
Weakest Q1: Hyster-Yale Materials Handling (NYSE: HY)
Playing a significant role in the development of the hydraulic lift truck, Hyster-Yale (NYSE: HY) designs, manufactures, and sells materials handling equipment to various sectors.
Hyster-Yale Materials Handling reported revenues of $910.4 million, down 13.8% year on year, falling short of analysts’ expectations by 3.9%. It was a disappointing quarter as it posted a significant miss of analysts’ EBITDA estimates and a miss of analysts’ EPS estimates.
Hyster-Yale Materials Handling delivered the slowest revenue growth in the group. Interestingly, the stock is up 5.7% since the results and currently trades at $42.86.
Read our full analysis of Hyster-Yale Materials Handling’s results here.
Lincoln Electric (NASDAQ: LECO)
Headquartered in Ohio, Lincoln Electric (NASDAQ: LECO) manufactures and sells welding equipment for various industries.
Lincoln Electric reported revenues of $1.00 billion, up 2.4% year on year. This print topped analysts’ expectations by 2.9%. Zooming out, it was a mixed quarter as it also logged a narrow beat of analysts’ organic revenue estimates but a miss of analysts’ EPS estimates.
Lincoln Electric achieved the biggest analyst estimates beat among its peers. The stock is up 21.8% since reporting and currently trades at $223.89.
Read our full, actionable report on Lincoln Electric here, it’s free.
Nordson (NASDAQ: NDSN)
Founded in 1954, Nordson Corporation (NASDAQ: NDSN) manufactures dispensing equipment and industrial adhesives, sealants and coatings.
Nordson reported revenues of $682.9 million, up 5% year on year. This number beat analysts’ expectations by 1.1%. Aside from that, it was a satisfactory quarter as it also recorded EPS guidance for next quarter topping analysts’ expectations but organic revenue in line with analysts’ estimates.
Nordson pulled off the fastest revenue growth among its peers. The stock is up 11.8% since reporting and currently trades at $218.72.
Read our full, actionable report on Nordson here, it’s free.
Market Update
The Fed’s interest rate hikes throughout 2022 and 2023 have successfully cooled post-pandemic inflation, bringing it closer to the 2% target. Inflationary pressures have eased without tipping the economy into a recession, suggesting a soft landing. This stability, paired with recent rate cuts (0.5% in September 2024 and 0.25% in November 2024), fueled a strong year for the stock market in 2024. The markets surged further after Donald Trump’s presidential victory in November, with major indices reaching record highs in the days following the election. Still, questions remain about the direction of economic policy, as potential tariffs and corporate tax changes add uncertainty for 2025.
Want to invest in winners with rock-solid fundamentals? Check out our 9 Best Market-Beating Stocks and add them to your watchlist. These companies are poised for growth regardless of the political or macroeconomic climate.
StockStory is growing and hiring equity analyst and marketing roles. Are you a 0 to 1 builder passionate about the markets and AI? See the open roles here.