
Offshore banking group Butterfield Bank (NYSE: NTB) missed Wall Street’s revenue expectations in Q2 CY2025 as sales rose 2.2% year on year to $146.3 million. Its non-GAAP profit of $1.26 per share was 3.3% above analysts’ consensus estimates.
Is now the time to buy Butterfield Bank? Find out by accessing our full research report, it’s free.
Butterfield Bank (NTB) Q2 CY2025 Highlights:
- Net Interest Income: $89.4 million vs analyst estimates of $89.51 million (2.2% year-on-year growth, in line)
- Net Interest Margin: 2.6% vs analyst estimates of 2.7% (flat year on year, 4.7 bps miss)
- Revenue: $146.3 million vs analyst estimates of $147.6 million (2.2% year-on-year growth, 0.9% miss)
- Efficiency Ratio: 61.1% vs analyst estimates of 62.4% (1.3 percentage point beat)
- Adjusted EPS: $1.26 vs analyst estimates of $1.22 (3.3% beat)
- Market Capitalization: $1.87 billion
Michael Collins, Butterfield's Chairman and Chief Executive Officer, commented, “This strong second quarter performance underscores the consistency of our high risk-adjusted returns, supported by disciplined risk management and high-quality client relationships. Butterfield’s proven business model and sustained through-cycle profitability gives our Board the confidence to increase the quarterly cash dividend rate by 14% and authorize a new share repurchase program. As we rebalance our capital return strategy, we continue to evaluate selective, fee-based acquisition opportunities."
Company Overview
Founded in 1784 as one of the oldest banks in the Western Hemisphere, Butterfield Bank (NYSE: NTB) provides banking, wealth management, and trust services to individuals and businesses in select offshore financial centers including Bermuda, Cayman Islands, and the Channel Islands.
Sales Growth
Two primary revenue streams drive bank earnings. While net interest income, which is earned by charging higher rates on loans than paid on deposits, forms the foundation, fee-based services across banking, credit, wealth management, and trading operations provide additional income.
Regrettably, Butterfield Bank’s revenue grew at a tepid 2.3% compounded annual growth rate over the last five years. This wasn’t a great result, but there are still things to like about Butterfield Bank.
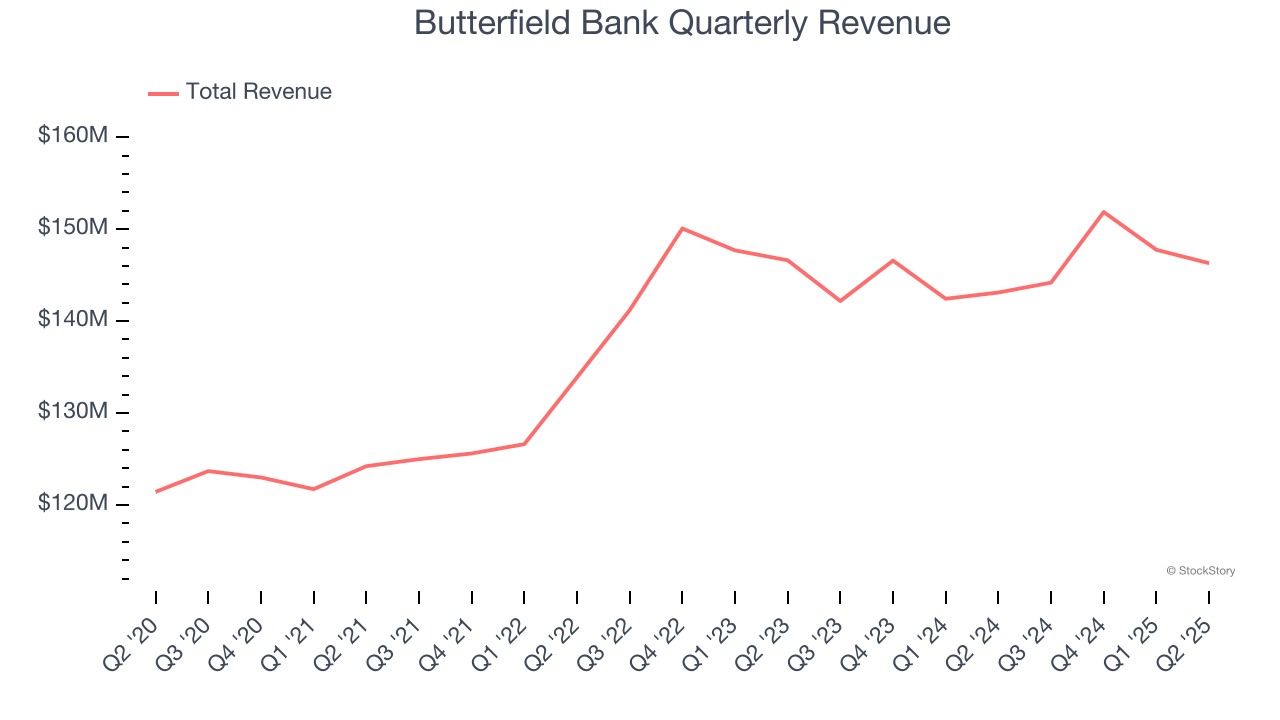
We at StockStory place the most emphasis on long-term growth, but within financials, a half-decade historical view may miss recent interest rate changes, market returns, and industry trends. Butterfield Bank’s recent performance shows its demand has slowed as its revenue was flat over the last two years. 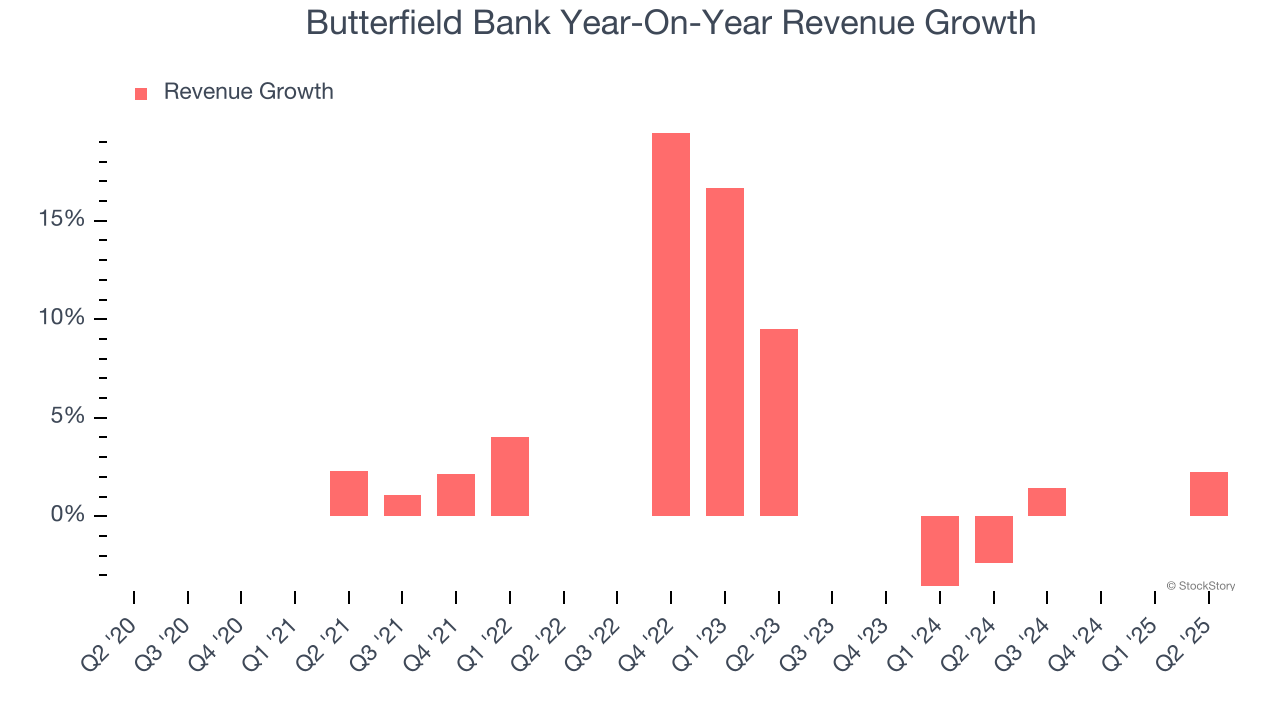 Note: Quarters not shown were determined to be outliers, impacted by outsized investment gains/losses that are not indicative of the recurring fundamentals of the business.
This quarter, Butterfield Bank’s revenue grew by 2.2% year on year to $146.3 million, falling short of Wall Street’s estimates.
Net interest income made up 79.6% of the company’s total revenue during the last five years, meaning lending operations are Butterfield Bank’s largest source of revenue.
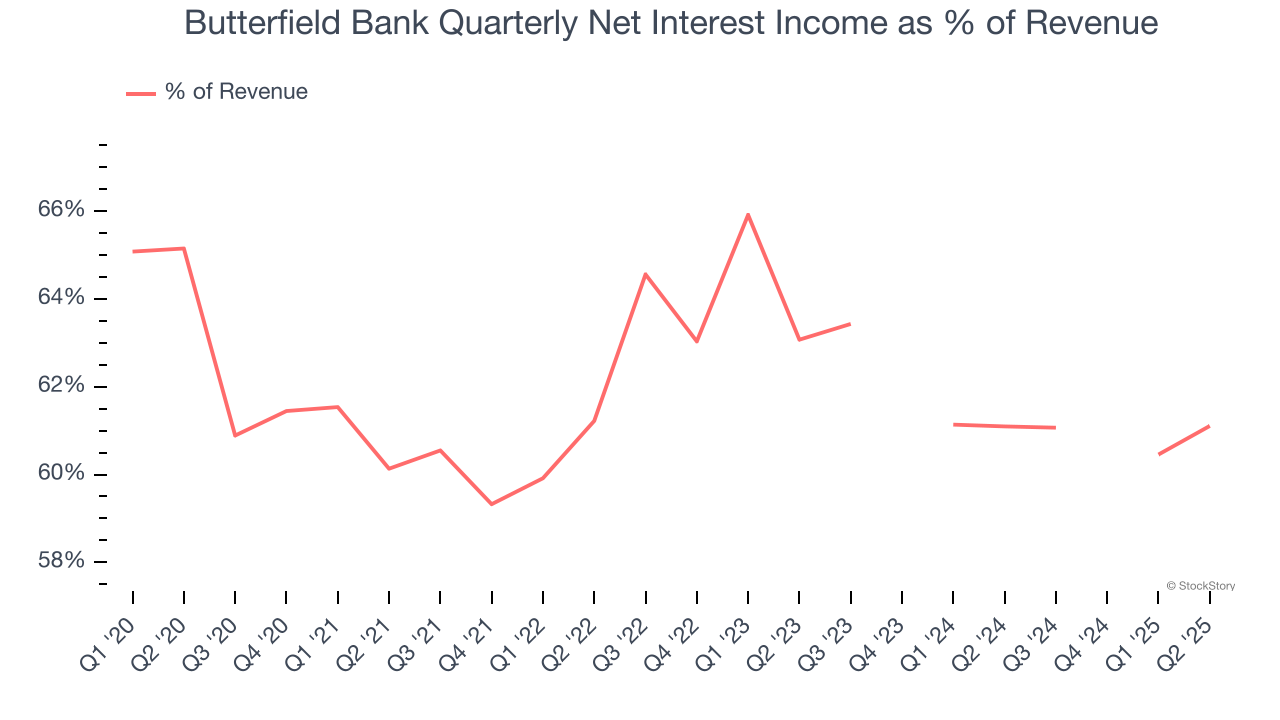 Note: Quarters not shown were determined to be outliers, impacted by outsized investment gains/losses that are not indicative of the recurring fundamentals of the business.
Markets consistently prioritize net interest income growth over fee-based revenue, recognizing its superior quality and recurring nature compared to the more unpredictable non-interest income streams.
Unless you’ve been living under a rock, it should be obvious by now that generative AI is going to have a huge impact on how large corporations do business. While Nvidia and AMD are trading close to all-time highs, we prefer a lesser-known (but still profitable) stock benefiting from the rise of AI. Click here to access our free report one of our favorites growth stories.
Tangible Book Value Per Share (TBVPS)
Banks operate as balance sheet businesses, with profits generated through borrowing and lending activities. Valuations reflect this reality, emphasizing balance sheet strength and long-term book value compounding ability.
When analyzing banks, tangible book value per share (TBVPS) takes precedence over many other metrics. This measure isolates genuine per-share value by removing intangible assets of debatable liquidation worth. EPS can become murky due to acquisition impacts or accounting flexibility around loan provisions, and TBVPS resists financial engineering manipulation.
Butterfield Bank’s TBVPS grew at a decent 5.8% annual clip over the last five years. TBVPS growth has accelerated recently, growing by 15.5% annually over the last two years from $17.83 to $23.77 per share.
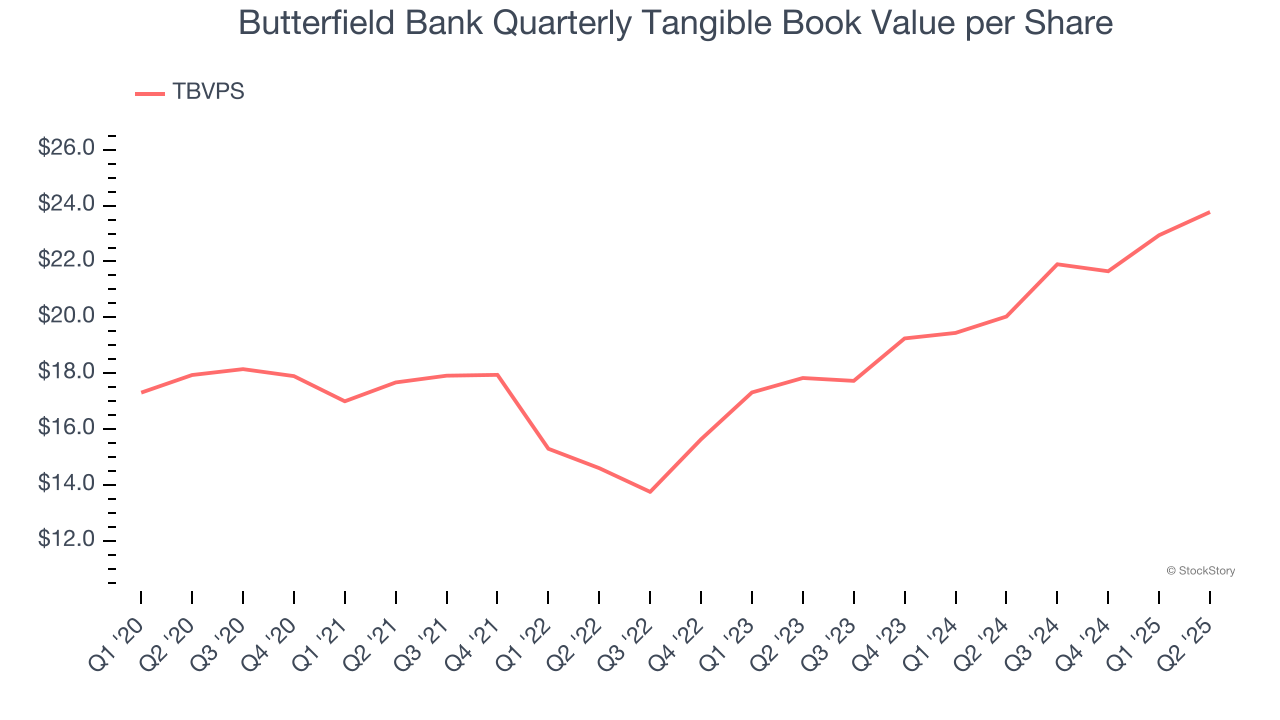
Over the next 12 months, Consensus estimates call for Butterfield Bank’s TBVPS to grow by 15.1% to $27.35, top-notch growth rate.
Key Takeaways from Butterfield Bank’s Q2 Results
We struggled to find many positives in these results as its top-line performance fell short of Wall Street’s estimates. Overall, this quarter could have been better. The stock remained flat at $44.80 immediately after reporting.
So should you invest in Butterfield Bank right now? When making that decision, it’s important to consider its valuation, business qualities, as well as what has happened in the latest quarter. We cover that in our actionable full research report which you can read here, it’s free.


