
Diversified bank holding company Merchants Bancorp (NASDAQCM:MBIN) reported Q2 CY2025 results topping the market’s revenue expectations, with sales up 12.4% year on year to $179.2 million. Its GAAP profit of $0.60 per share was 48.3% below analysts’ consensus estimates.
Is now the time to buy Merchants Bancorp? Find out by accessing our full research report, it’s free.
Merchants Bancorp (MBIN) Q2 CY2025 Highlights:
- Net Interest Income: $128.7 million vs analyst estimates of $130.5 million (flat year on year, 1.4% miss)
- Net Interest Margin: 2.8% vs analyst estimates of 2.9% (16 basis point year-on-year decrease, 9.5 bps miss)
- Revenue: $179.2 million vs analyst estimates of $159.2 million (12.4% year-on-year growth, 12.5% beat)
- Efficiency Ratio: 43.2% vs analyst estimates of 39.6% (3.5 percentage point miss)
- EPS (GAAP): $0.60 vs analyst expectations of $1.16 (48.3% miss)
- Market Capitalization: $1.59 billion
Company Overview
With a strategic focus on low-risk, government-backed lending programs, Merchants Bancorp (NASDAQCM:MBIN) is an Indiana-based bank holding company specializing in multi-family mortgage banking, mortgage warehousing, and traditional banking services.
Sales Growth
Net interest income and and fee-based revenue are the two pillars supporting bank earnings. The former captures profit from the gap between lending rates and deposit costs, while the latter encompasses charges for banking services, credit products, wealth management, and trading activities.
Thankfully, Merchants Bancorp’s 22.8% annualized revenue growth over the last five years was incredible. Its growth surpassed the average bank company and shows its offerings resonate with customers, a great starting point for our analysis.
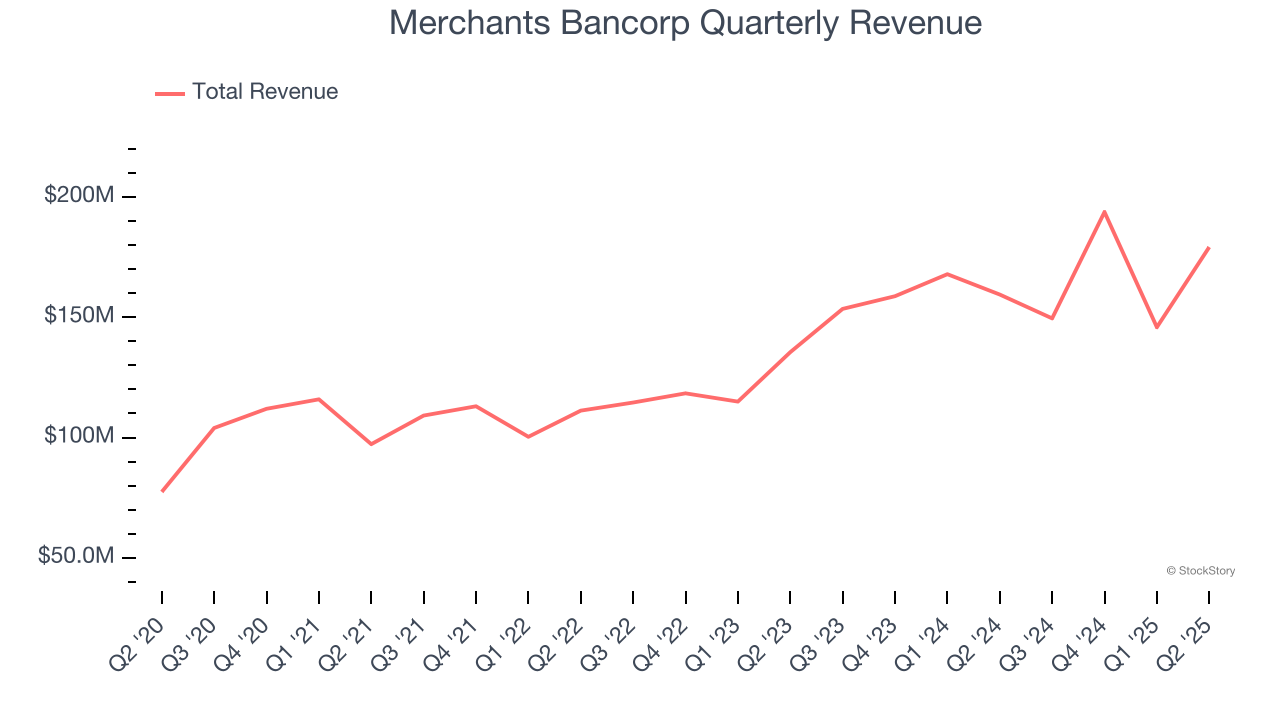
Long-term growth is the most important, but within financials, a half-decade historical view may miss recent interest rate changes and market returns. Merchants Bancorp’s annualized revenue growth of 17.6% over the last two years is below its five-year trend, but we still think the results suggest healthy demand. 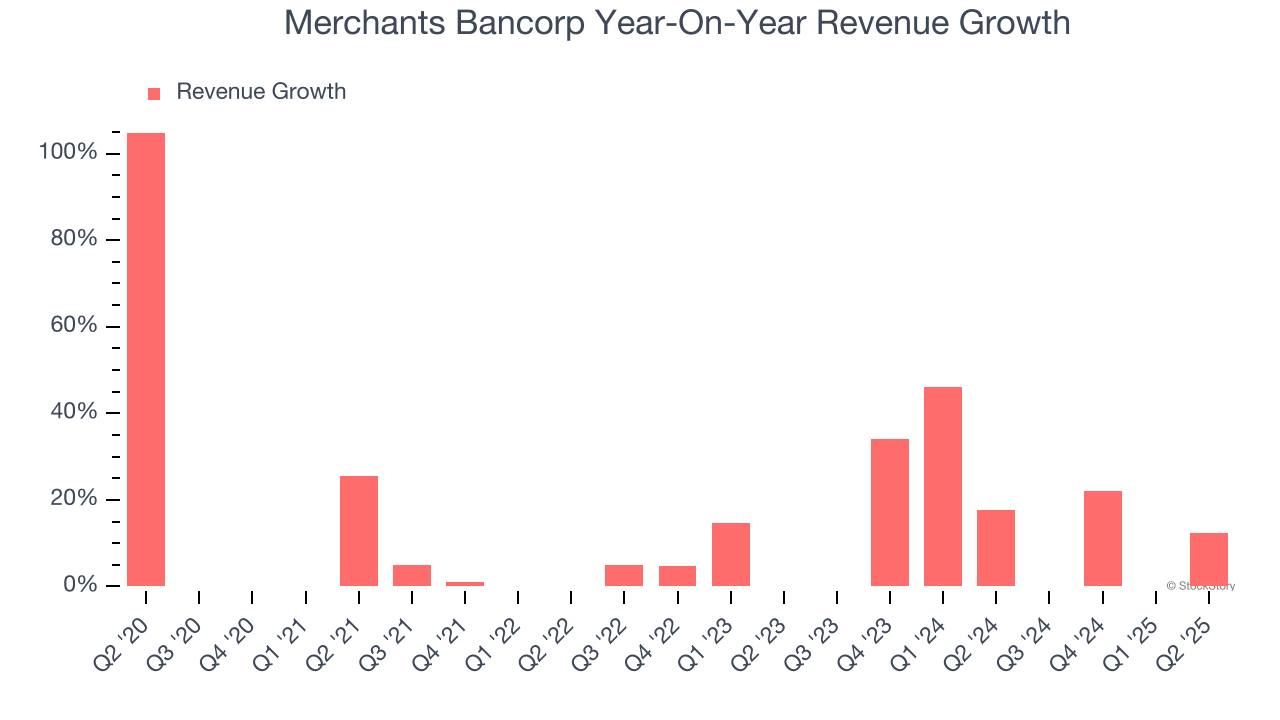 Note: Quarters not shown were determined to be outliers, impacted by outsized investment gains/losses that are not indicative of the recurring fundamentals of the business.
This quarter, Merchants Bancorp reported year-on-year revenue growth of 12.4%, and its $179.2 million of revenue exceeded Wall Street’s estimates by 12.5%.
Net interest income made up 72.8% of the company’s total revenue during the last five years, meaning lending operations are Merchants Bancorp’s largest source of revenue.
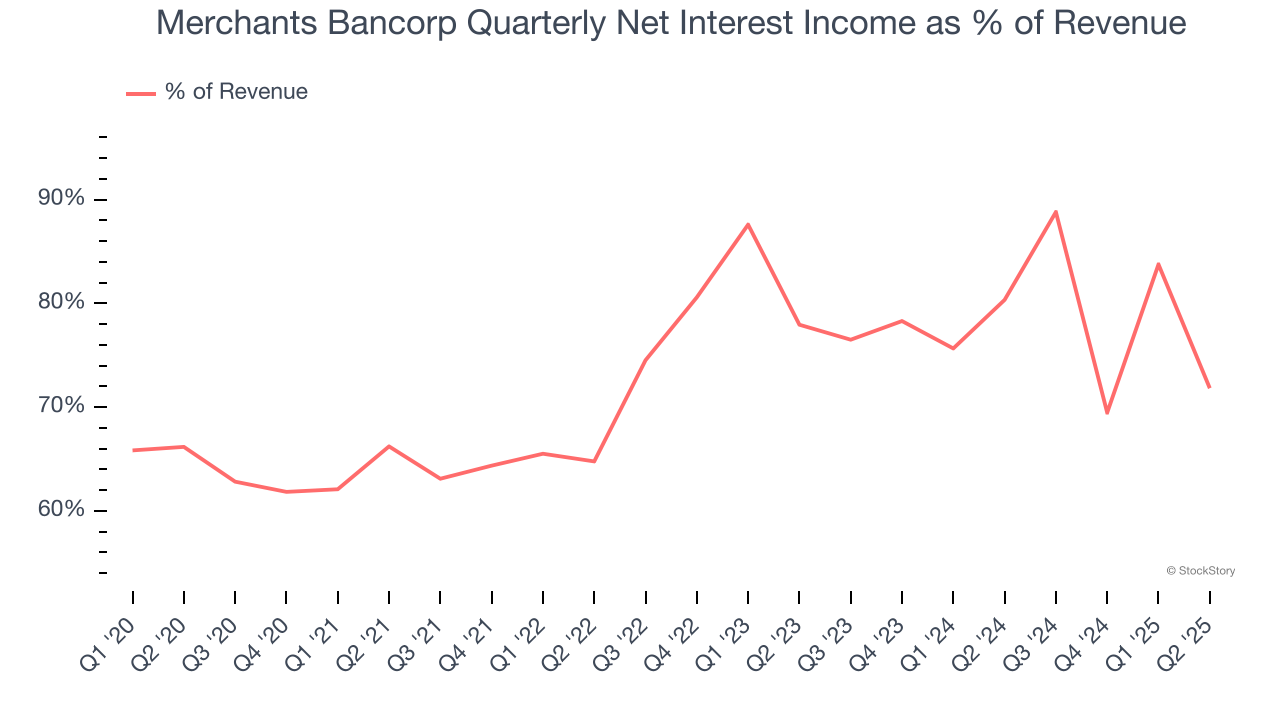
Our experience and research show the market cares primarily about a bank’s net interest income growth as non-interest income is considered a lower-quality and non-recurring revenue source.
Unless you’ve been living under a rock, it should be obvious by now that generative AI is going to have a huge impact on how large corporations do business. While Nvidia and AMD are trading close to all-time highs, we prefer a lesser-known (but still profitable) stock benefiting from the rise of AI. Click here to access our free report one of our favorites growth stories.
Tangible Book Value Per Share (TBVPS)
Banks profit by intermediating between depositors and borrowers, making them fundamentally balance sheet-driven enterprises. Market participants emphasize balance sheet quality and sustained book value growth when evaluating these institutions.
This explains why tangible book value per share (TBVPS) stands as the premier banking metric. TBVPS strips away questionable intangible assets, revealing concrete per-share net worth that investors can trust. Other (and more commonly known) per-share metrics like EPS can sometimes be murky due to M&A or accounting rules allowing for loan losses to be spread out.
Merchants Bancorp’s TBVPS grew at an incredible 26.2% annual clip over the last five years. TBVPS growth has recently decelerated to 21.1% annual growth over the last two years (from $24.14 to $35.42 per share).
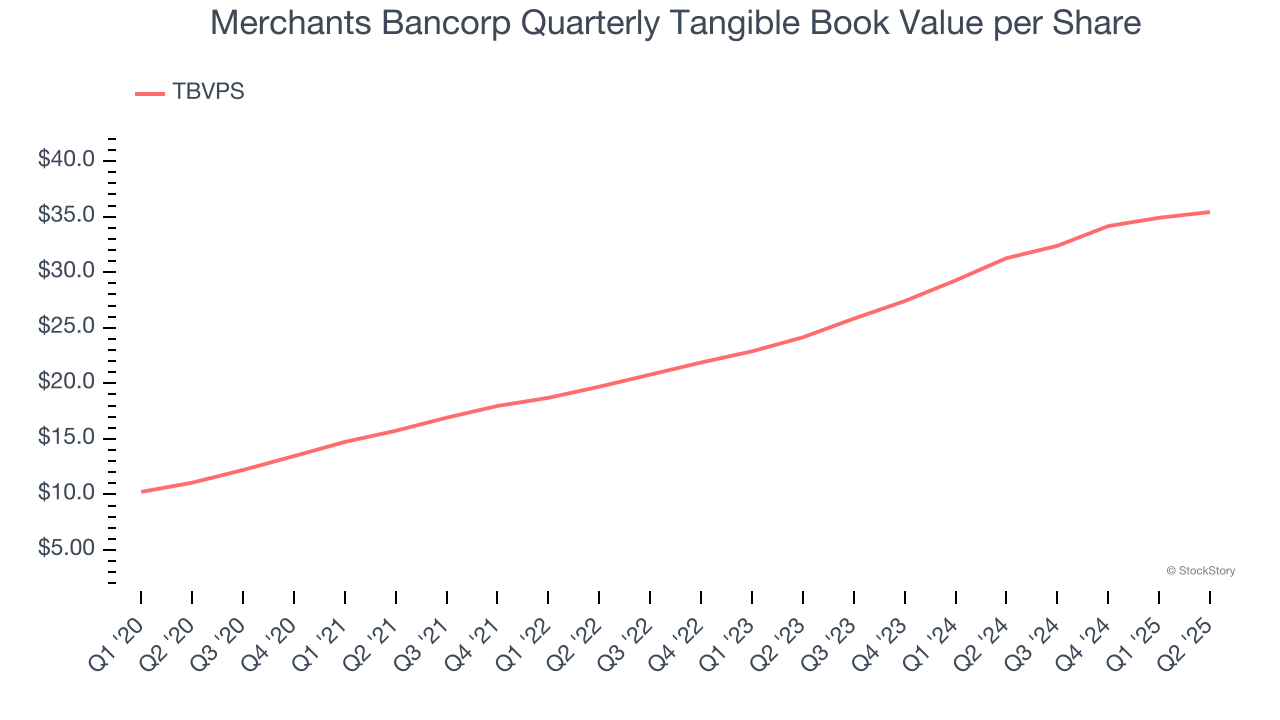
Over the next 12 months, Consensus estimates call for Merchants Bancorp’s TBVPS to grow by 14.5% to $40.54, top-notch growth rate.
Key Takeaways from Merchants Bancorp’s Q2 Results
We were impressed by how significantly Merchants Bancorp blew past analysts’ revenue expectations this quarter. On the other hand, its EPS missed and its net interest income fell slightly short of Wall Street’s estimates. Overall, this quarter could have been better. The stock traded down 2.1% to $34.36 immediately following the results.
Merchants Bancorp didn’t show it’s best hand this quarter, but does that create an opportunity to buy the stock right now? We think that the latest quarter is only one piece of the longer-term business quality puzzle. Quality, when combined with valuation, can help determine if the stock is a buy. We cover that in our actionable full research report which you can read here, it’s free.


