
Life sciences company Revvity (NYSE: RVTY) beat Wall Street’s revenue expectations in Q2 CY2025, with sales up 4.1% year on year to $720.3 million. The company expects the full year’s revenue to be around $2.86 billion, close to analysts’ estimates. Its non-GAAP profit of $1.18 per share was 3.4% above analysts’ consensus estimates.
Is now the time to buy Revvity? Find out by accessing our full research report, it’s free.
Revvity (RVTY) Q2 CY2025 Highlights:
- Revenue: $720.3 million vs analyst estimates of $712.3 million (4.1% year-on-year growth, 1.1% beat)
- Adjusted EPS: $1.18 vs analyst estimates of $1.14 (3.4% beat)
- Adjusted EBITDA: $203.7 million vs analyst estimates of $205.5 million (28.3% margin, 0.9% miss)
- The company slightly lifted its revenue guidance for the full year to $2.86 billion at the midpoint from $2.85 billion
- Management lowered its full-year Adjusted EPS guidance to $4.90 at the midpoint, a 1% decrease
- Operating Margin: 12.6%, in line with the same quarter last year
- Free Cash Flow Margin: 16%, down from 19.7% in the same quarter last year
- Organic Revenue rose 3% year on year (-1% in the same quarter last year)
- Market Capitalization: $12.22 billion
“The power of Revvity's transformation and consistent execution were evident in our second-quarter performance, enabling us to exceed expectations despite the evolving market environment,” said Prahlad Singh, president and chief executive officer of Revvity.
Company Overview
Formerly known as PerkinElmer until its rebranding in 2023, Revvity (NYSE: RVTY) provides health science technologies and services that support the complete workflow from discovery to development and diagnosis to cure.
Revenue Growth
A company’s long-term sales performance is one signal of its overall quality. Any business can put up a good quarter or two, but many enduring ones grow for years. Revvity’s demand was weak over the last five years as its sales fell at a 1.2% annual rate. This was below our standards and is a sign of poor business quality.
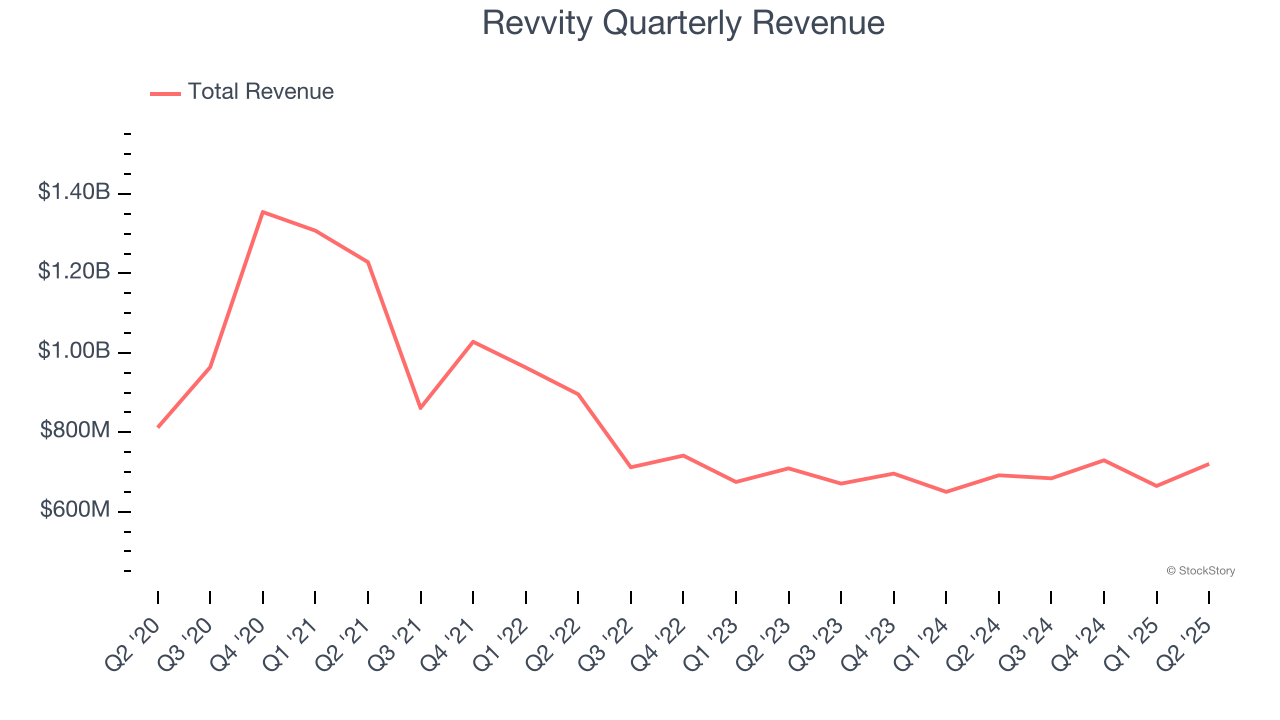
Long-term growth is the most important, but within healthcare, a half-decade historical view may miss new innovations or demand cycles. Revvity’s revenue over the last two years was flat, sugggesting its demand was weak but stabilized after its initial drop. 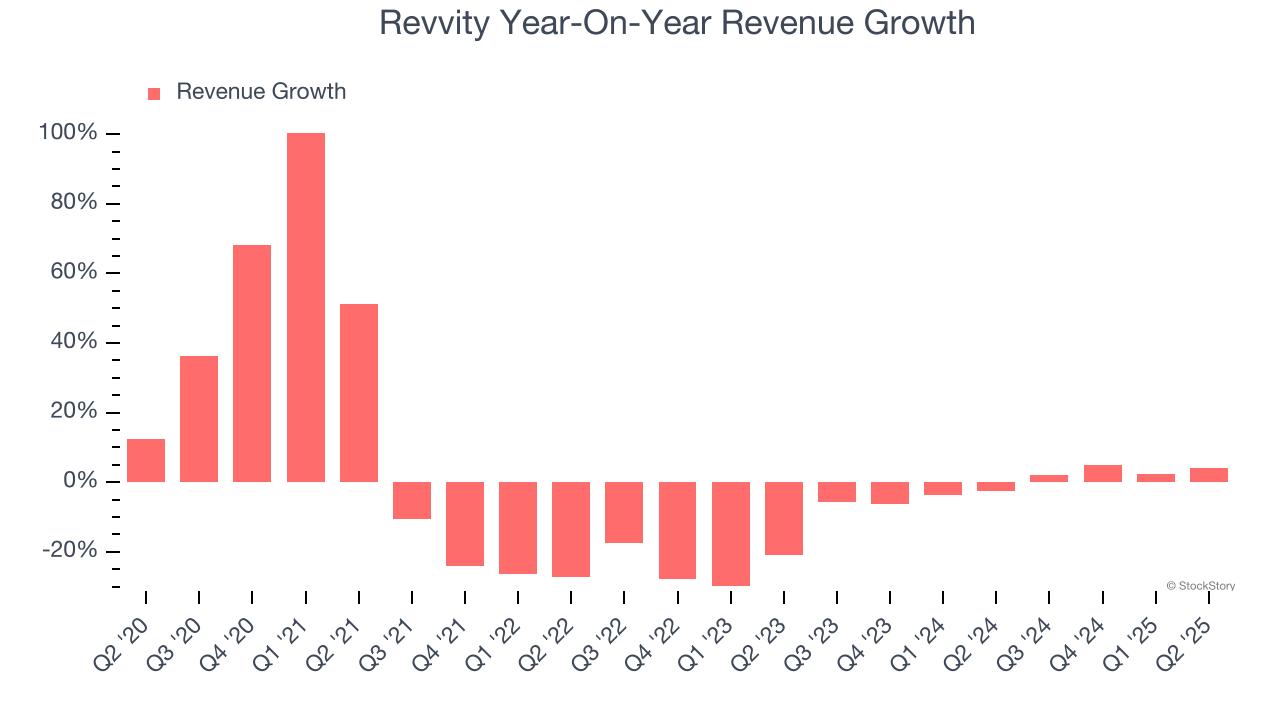
We can better understand the company’s sales dynamics by analyzing its organic revenue, which strips out one-time events like acquisitions and currency fluctuations that don’t accurately reflect its fundamentals. Over the last two years, Revvity’s organic revenue was flat. Because this number aligns with its normal revenue growth, we can see the company’s core operations (not acquisitions and divestitures) drove most of its results. 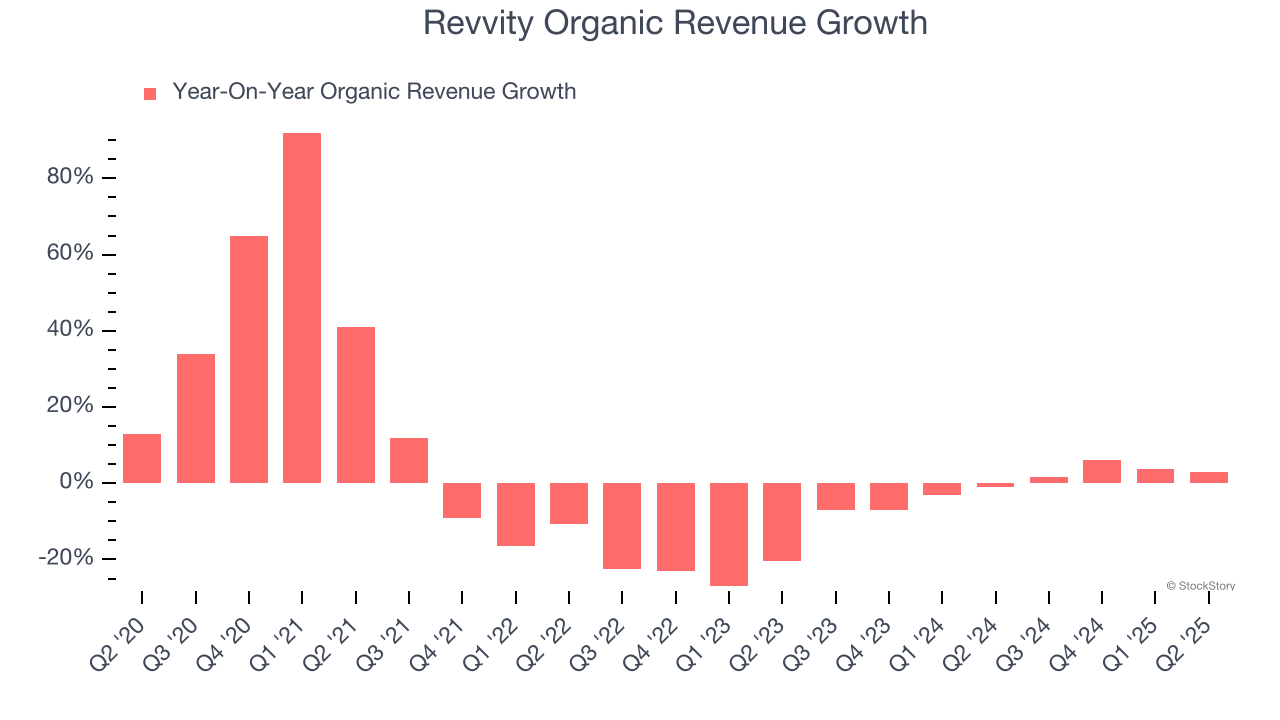
This quarter, Revvity reported modest year-on-year revenue growth of 4.1% but beat Wall Street’s estimates by 1.1%.
Looking ahead, sell-side analysts expect revenue to grow 4.8% over the next 12 months. While this projection implies its newer products and services will fuel better top-line performance, it is still below the sector average.
Today’s young investors won’t have read the timeless lessons in Gorilla Game: Picking Winners In High Technology because it was written more than 20 years ago when Microsoft and Apple were first establishing their supremacy. But if we apply the same principles, then enterprise software stocks leveraging their own generative AI capabilities may well be the Gorillas of the future. So, in that spirit, we are excited to present our Special Free Report on a profitable, fast-growing enterprise software stock that is already riding the automation wave and looking to catch the generative AI next.
Operating Margin
Revvity has been an efficient company over the last five years. It was one of the more profitable businesses in the healthcare sector, boasting an average operating margin of 21.6%.
Looking at the trend in its profitability, Revvity’s operating margin decreased by 18.5 percentage points over the last five years. Even though its historical margin was healthy, shareholders will want to see Revvity become more profitable in the future.
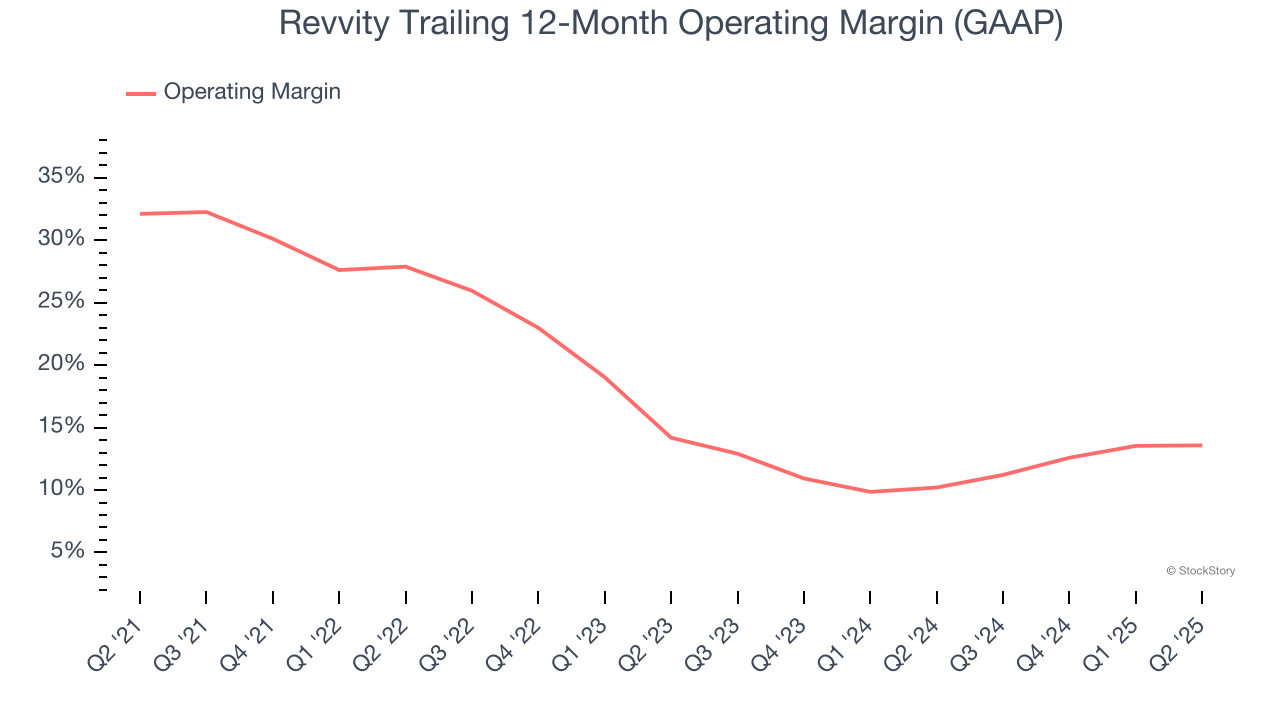
In Q2, Revvity generated an operating margin profit margin of 12.6%, in line with the same quarter last year. This indicates the company’s overall cost structure has been relatively stable.
Earnings Per Share
We track the long-term change in earnings per share (EPS) for the same reason as long-term revenue growth. Compared to revenue, however, EPS highlights whether a company’s growth is profitable.
Revvity’s EPS grew at an unimpressive 1% compounded annual growth rate over the last five years. This performance was better than its 1.2% annualized revenue declines, but we take it with a grain of salt because its operating margin didn’t improve and it didn’t repurchase its shares, meaning the delta came from reduced interest expenses or taxes.
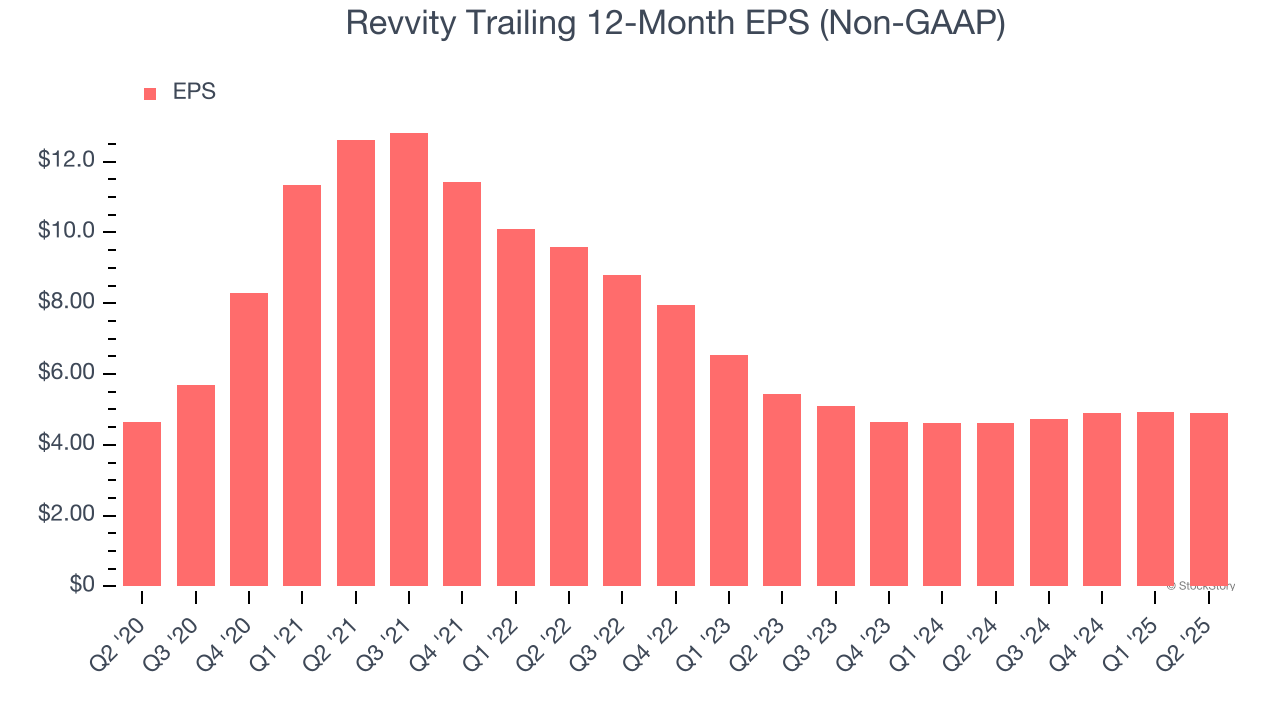
In Q2, Revvity reported EPS at $1.18, down from $1.22 in the same quarter last year. Despite falling year on year, this print beat analysts’ estimates by 3.4%. Over the next 12 months, Wall Street expects Revvity’s full-year EPS of $4.89 to grow 8.2%.
Key Takeaways from Revvity’s Q2 Results
It was good to see Revvity narrowly top analysts’ revenue expectations this quarter. We were also happy its EPS outperformed Wall Street’s estimates. On the other hand, its full-year EPS guidance slightly missed. Zooming out, we think this was a mixed quarter. The stock remained flat at $103.70 immediately after reporting.
Should you buy the stock or not? When making that decision, it’s important to consider its valuation, business qualities, as well as what has happened in the latest quarter. We cover that in our actionable full research report which you can read here, it’s free.


