
Automotive retailer Lithia Motors (NYSE: LAD) fell short of the market’s revenue expectations in Q2 CY2025 as sales rose 3.8% year on year to $9.58 billion. Its non-GAAP profit of $10.24 per share was 4.4% above analysts’ consensus estimates.
Is now the time to buy Lithia? Find out by accessing our full research report, it’s free.
Lithia (LAD) Q2 CY2025 Highlights:
- Revenue: $9.58 billion vs analyst estimates of $9.78 billion (3.8% year-on-year growth, 2% miss)
- Adjusted EPS: $10.24 vs analyst estimates of $9.81 (4.4% beat)
- Adjusted EBITDA: $489.3 million vs analyst estimates of $453.3 million (5.1% margin, 7.9% beat)
- Operating Margin: 4.4%, in line with the same quarter last year
- Free Cash Flow was -$70.8 million compared to -$278.5 million in the same quarter last year
- Same-Store Sales rose 4.1% year on year (-6.4% in the same quarter last year)
- Market Capitalization: $7.99 billion
"Building on continued strength across our core operations, Lithia & Driveway's differentiated design once again powered record performance in the second quarter as we delivered a 25% year-over-year increase in diluted EPS. Operational excellence across the business translated into robust growth" said Bryan DeBoer, President and CEO.
Company Overview
With a strong presence in the Western US, Lithia Motors (NYSE: LAD) sells a wide range of vehicles, including new and used cars, trucks, SUVs, and luxury vehicles from various manufacturers.
Revenue Growth
A company’s long-term sales performance can indicate its overall quality. Any business can put up a good quarter or two, but the best consistently grow over the long haul.
With $37.2 billion in revenue over the past 12 months, Lithia is one of the larger companies in the consumer retail industry and benefits from a well-known brand that influences purchasing decisions.
As you can see below, Lithia’s sales grew at an exceptional 20.5% compounded annual growth rate over the last six years (we compare to 2019 to normalize for COVID-19 impacts) as it opened new stores and expanded its reach.
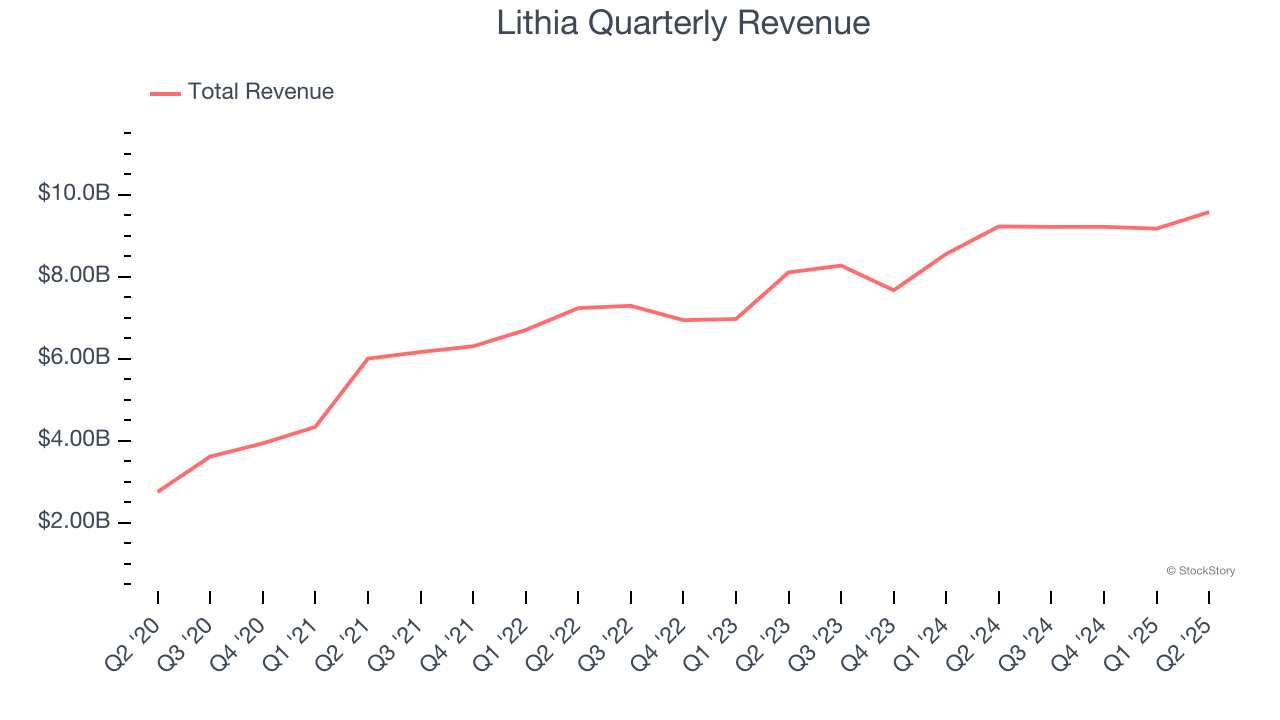
This quarter, Lithia’s revenue grew by 3.8% year on year to $9.58 billion, falling short of Wall Street’s estimates.
Looking ahead, sell-side analysts expect revenue to grow 3.3% over the next 12 months, a deceleration versus the last six years. We still think its growth trajectory is satisfactory given its scale and implies the market is forecasting success for its products.
Software is eating the world and there is virtually no industry left that has been untouched by it. That drives increasing demand for tools helping software developers do their jobs, whether it be monitoring critical cloud infrastructure, integrating audio and video functionality, or ensuring smooth content streaming. Click here to access a free report on our 3 favorite stocks to play this generational megatrend.
Store Performance
Number of Stores
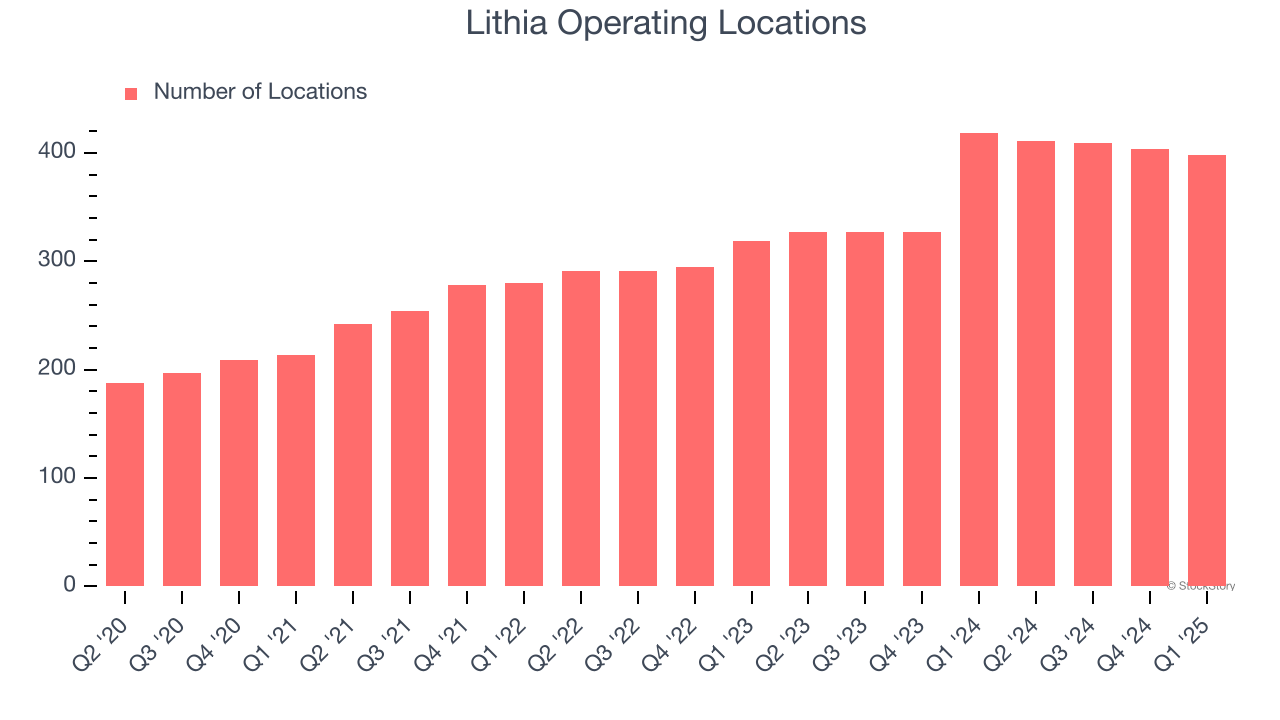
A retailer’s store count often determines how much revenue it can generate.
Lithia opened new stores at a rapid clip over the last two years, averaging 17.6% annual growth, much faster than the broader consumer retail sector.
When a retailer opens new stores, it usually means it’s investing for growth because demand is greater than supply, especially in areas where consumers may not have a store within reasonable driving distance.
Note that Lithia reports its store count intermittently, so some data points are missing in the chart below.
Same-Store Sales
A company's store base only paints one part of the picture. When demand is high, it makes sense to open more. But when demand is low, it’s prudent to close some locations and use the money in other ways. Same-store sales gives us insight into this topic because it measures organic growth for a retailer's e-commerce platform and brick-and-mortar shops that have existed for at least a year.
Lithia’s demand within its existing locations has barely increased over the last two years as its same-store sales were flat. Lithia should consider improving its foot traffic and efficiency before expanding its store base.
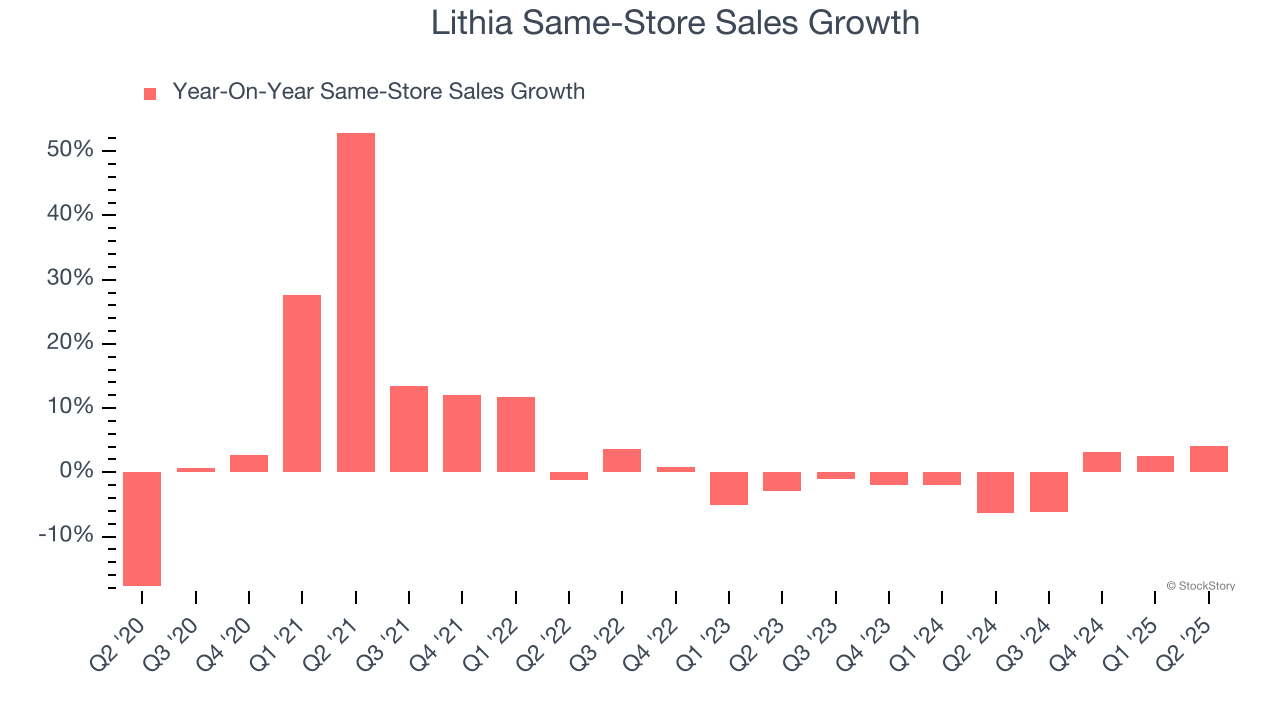
In the latest quarter, Lithia’s same-store sales rose 4.1% year on year. This growth was a well-appreciated turnaround from its historical levels, showing the business is regaining momentum.
Key Takeaways from Lithia’s Q2 Results
We were impressed by how significantly Lithia blew past analysts’ EBITDA expectations this quarter. We were also glad its gross margin outperformed Wall Street’s estimates. On the other hand, its revenue missed. Overall, this print had some key positives. The stock traded up 3.2% to $316.99 immediately after reporting.
Indeed, Lithia had a rock-solid quarterly earnings result, but is this stock a good investment here? If you’re making that decision, you should consider the bigger picture of valuation, business qualities, as well as the latest earnings. We cover that in our actionable full research report which you can read here, it’s free.