Casino resort and entertainment company Red Rock Resorts (NASDAQ: RRR) reported Q2 CY2025 results beating Wall Street’s revenue expectations, with sales up 8.2% year on year to $526.3 million. Its GAAP profit of $0.95 per share was significantly above analysts’ consensus estimates.
Is now the time to buy Red Rock Resorts? Find out by accessing our full research report, it’s free.
Red Rock Resorts (RRR) Q2 CY2025 Highlights:
- Revenue: $526.3 million vs analyst estimates of $485.4 million (8.2% year-on-year growth, 8.4% beat)
- EPS (GAAP): $0.95 vs analyst estimates of $0.41 (significant beat)
- Adjusted EBITDA: $229.4 million vs analyst estimates of $197.2 million (43.6% margin, 16.3% beat)
- Operating Margin: 31.9%, up from 29% in the same quarter last year
- Market Capitalization: $3.24 billion
Company Overview
Founded in 1976, Red Rock Resorts (NASDAQ: RRR) operates a range of casino resorts and entertainment properties, primarily in the Las Vegas metropolitan area.
Revenue Growth
A company’s long-term performance is an indicator of its overall quality. Even a bad business can shine for one or two quarters, but a top-tier one grows for years. Unfortunately, Red Rock Resorts’s 7.1% annualized revenue growth over the last five years was sluggish. This fell short of our benchmark for the consumer discretionary sector and is a poor baseline for our analysis.
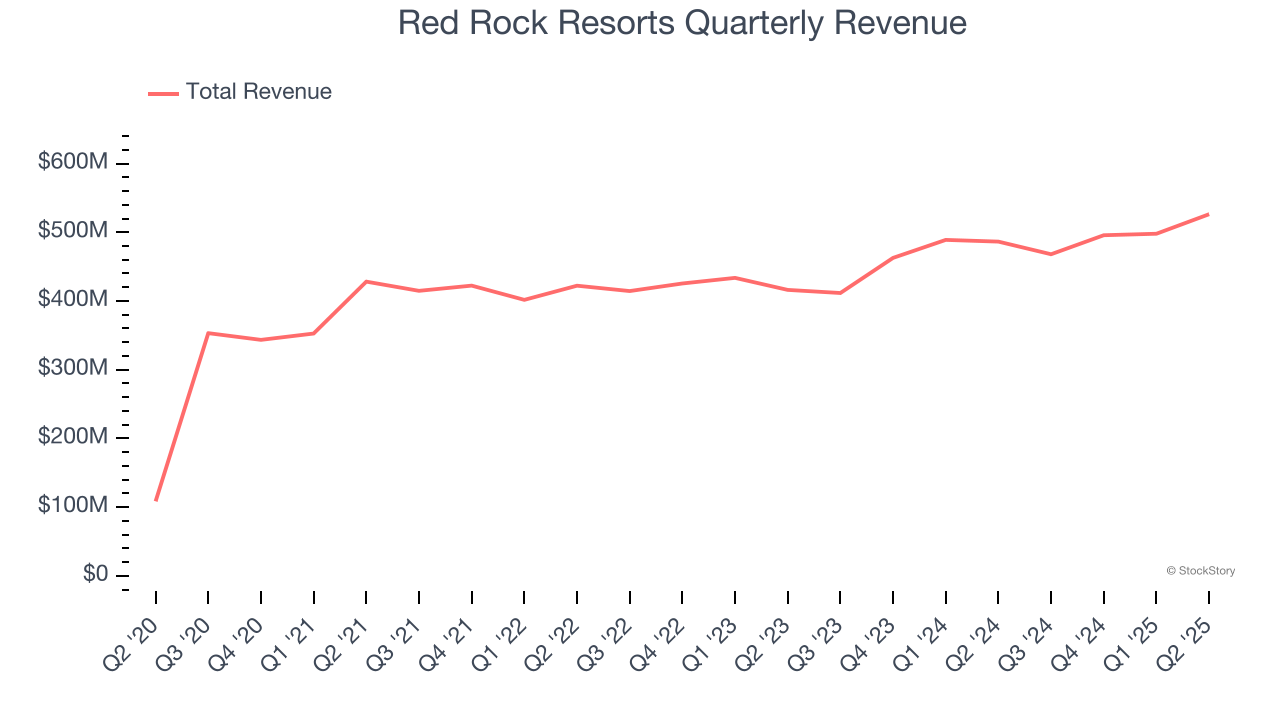
We at StockStory place the most emphasis on long-term growth, but within consumer discretionary, a stretched historical view may miss a company riding a successful new product or trend. Red Rock Resorts’s annualized revenue growth of 8.5% over the last two years is above its five-year trend, but we were still disappointed by the results. Note that COVID hurt Red Rock Resorts’s business in 2020 and part of 2021, and it bounced back in a big way thereafter. 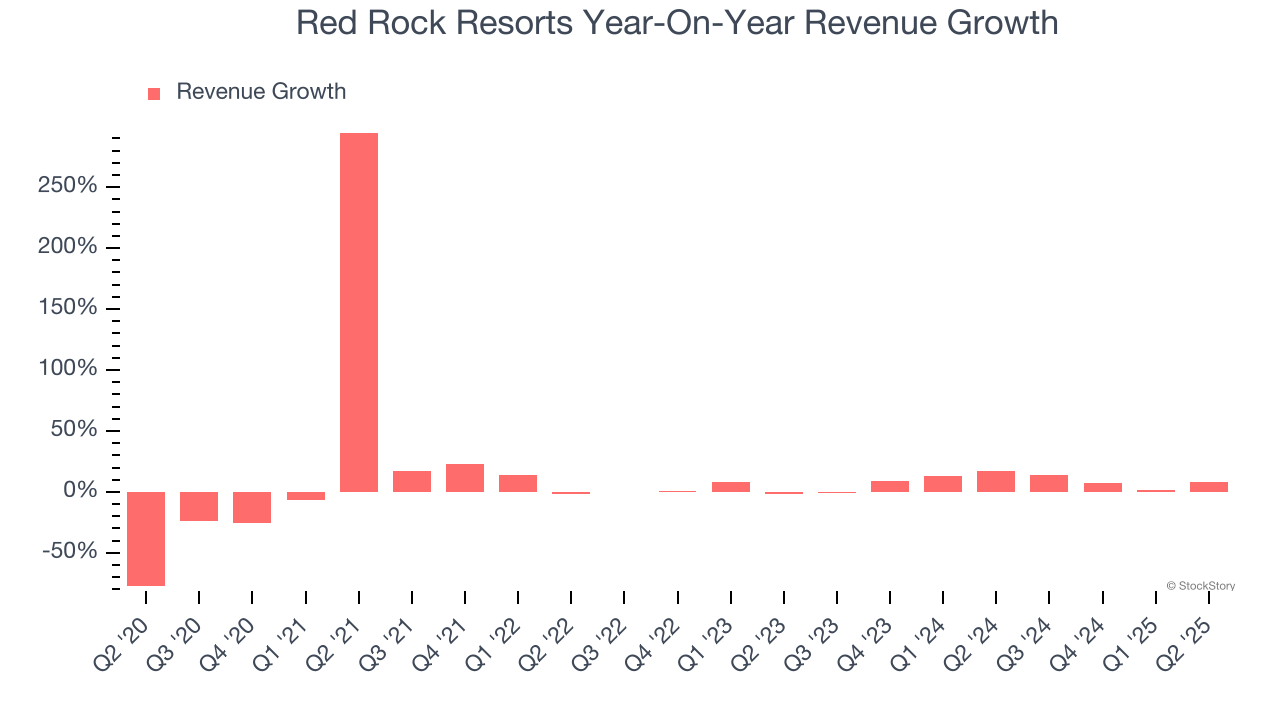
This quarter, Red Rock Resorts reported year-on-year revenue growth of 8.2%, and its $526.3 million of revenue exceeded Wall Street’s estimates by 8.4%.
Looking ahead, sell-side analysts expect revenue to decline by 1.2% over the next 12 months, a deceleration versus the last two years. This projection doesn't excite us and indicates its products and services will face some demand challenges.
Here at StockStory, we certainly understand the potential of thematic investing. Diverse winners from Microsoft (MSFT) to Alphabet (GOOG), Coca-Cola (KO) to Monster Beverage (MNST) could all have been identified as promising growth stories with a megatrend driving the growth. So, in that spirit, we’ve identified a relatively under-the-radar profitable growth stock benefiting from the rise of AI, available to you FREE via this link.
Operating Margin
Red Rock Resorts’s operating margin has been trending down over the last 12 months, but it still averaged 31% over the last two years, elite for a consumer discretionary business. This shows it’s an well-run company with an efficient cost structure.
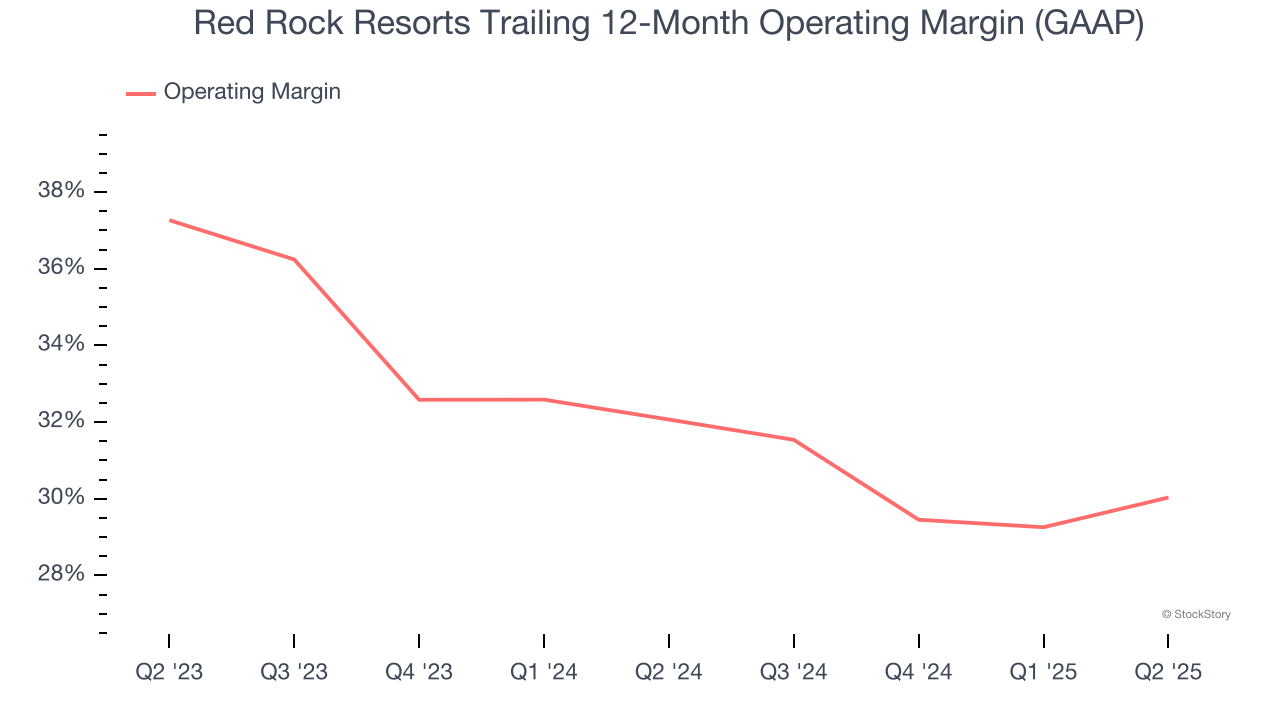
This quarter, Red Rock Resorts generated an operating margin profit margin of 31.9%, up 2.9 percentage points year on year. This increase was a welcome development and shows it was more efficient.
Earnings Per Share
Revenue trends explain a company’s historical growth, but the long-term change in earnings per share (EPS) points to the profitability of that growth – for example, a company could inflate its sales through excessive spending on advertising and promotions.
Red Rock Resorts’s full-year EPS flipped from negative to positive over the last five years. This is encouraging and shows it’s at a critical moment in its life.
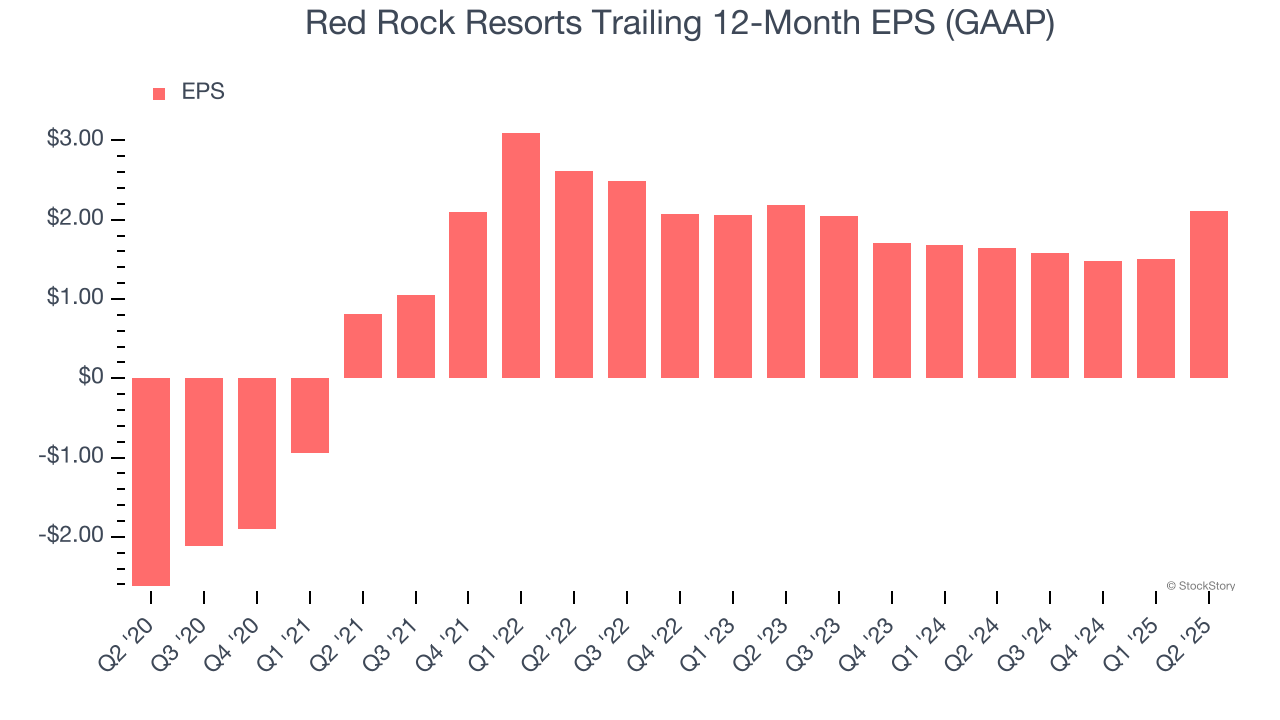
In Q2, Red Rock Resorts reported EPS at $0.95, up from $0.34 in the same quarter last year. This print easily cleared analysts’ estimates, and shareholders should be content with the results. Over the next 12 months, Wall Street expects Red Rock Resorts’s full-year EPS of $2.11 to shrink by 18.3%.
Key Takeaways from Red Rock Resorts’s Q2 Results
We were impressed by how significantly Red Rock Resorts blew past analysts’ EPS expectations this quarter. We were also excited its revenue outperformed Wall Street’s estimates by a wide margin. Zooming out, we think this quarter featured some important positives. The stock remained flat at $55.01 immediately following the results.
Sure, Red Rock Resorts had a solid quarter, but if we look at the bigger picture, is this stock a buy? The latest quarter does matter, but not nearly as much as longer-term fundamentals and valuation, when deciding if the stock is a buy. We cover that in our actionable full research report which you can read here, it’s free.