
Crane NXT has been treading water for the past six months, recording a small loss of 4.9% while holding steady at $56.68. The stock also fell short of the S&P 500’s 4.8% gain during that period.
Is now the time to buy Crane NXT, or should you be careful about including it in your portfolio? Get the full stock story straight from our expert analysts, it’s free.
Why Is Crane NXT Not Exciting?
We're cautious about Crane NXT. Here are three reasons why we avoid CXT and a stock we'd rather own.
1. Slow Organic Growth Suggests Waning Demand In Core Business
We can better understand Specialized Technology companies by analyzing their organic revenue. This metric gives visibility into Crane NXT’s core business because it excludes one-time events such as mergers, acquisitions, and divestitures along with foreign currency fluctuations - non-fundamental factors that can manipulate the income statement.
Over the last two years, Crane NXT’s organic revenue averaged 1.8% year-on-year growth. This performance was underwhelming and suggests it may need to improve its products, pricing, or go-to-market strategy, which can add an extra layer of complexity to its operations. 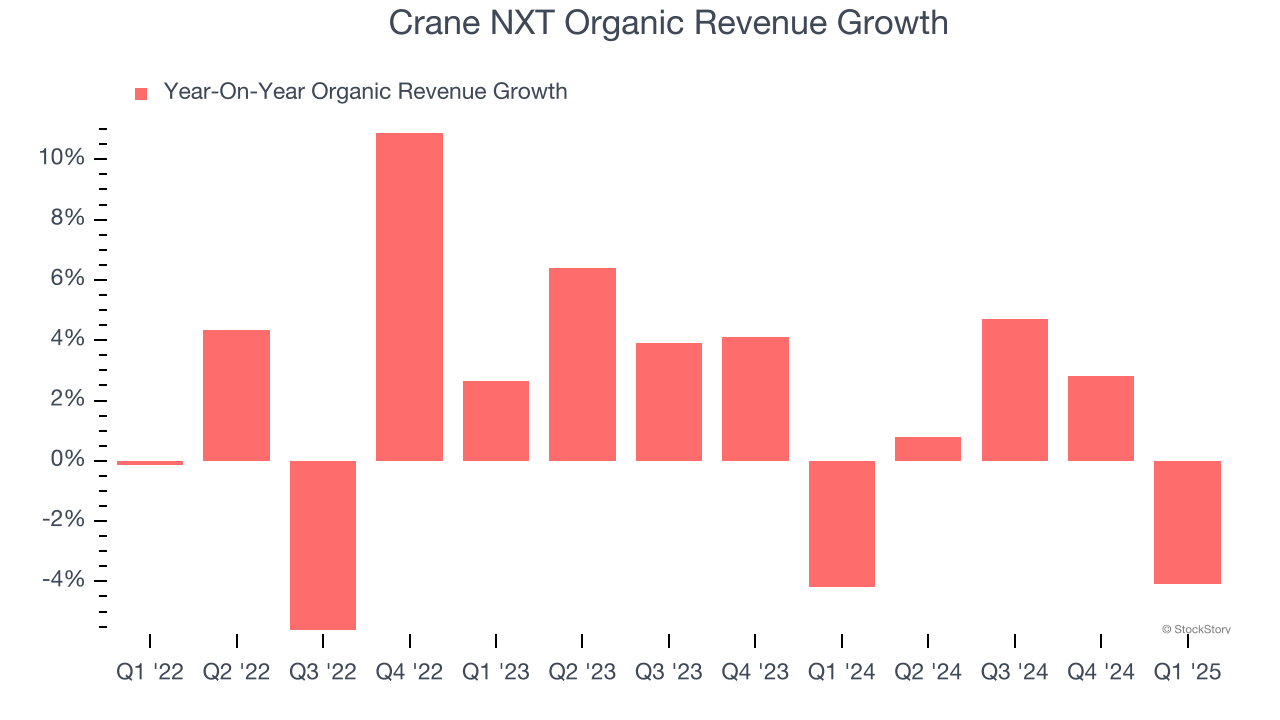
2. Fewer Distribution Channels Limit its Ceiling
With $1.50 billion in revenue over the past 12 months, Crane NXT is a small player in the business services space, which sometimes brings disadvantages compared to larger competitors benefiting from economies of scale and numerous distribution channels. On the bright side, it can grow faster because it has more room to expand.
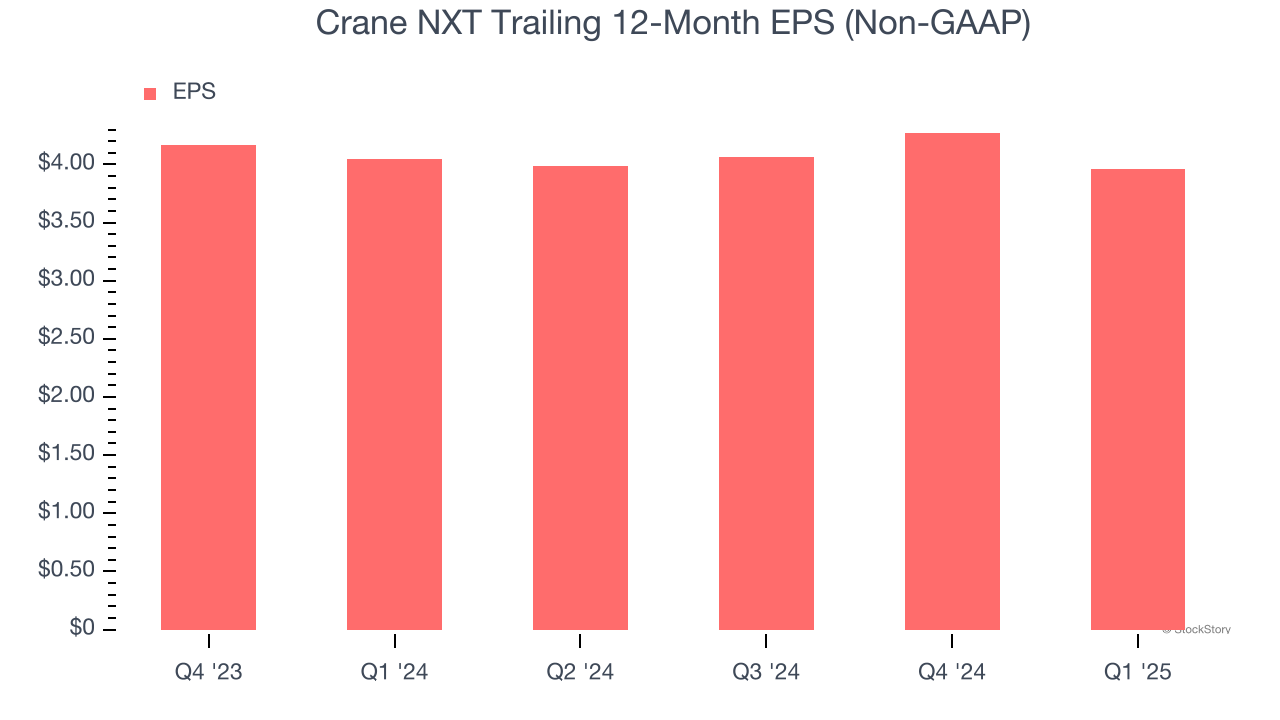
3. EPS Trending Down
Analyzing the change in earnings per share (EPS) shows whether a company's incremental sales were profitable – for example, revenue could be inflated through excessive spending on advertising and promotions.
Crane NXT’s full-year EPS dropped 2.2%, or 2.2% annually, over the last one years. We tend to steer our readers away from companies with falling revenue and EPS, where diminishing earnings could imply changing secular trends and preferences. If the tide turns unexpectedly, Crane NXT’s low margin of safety could leave its stock price susceptible to large downswings.
Final Judgment
Crane NXT isn’t a terrible business, but it doesn’t pass our quality test. With its shares trailing the market in recent months, the stock trades at 12.9× forward P/E (or $56.68 per share). Investors with a higher risk tolerance might like the company, but we think the potential downside is too great. We're pretty confident there are more exciting stocks to buy at the moment. We’d recommend looking at a top digital advertising platform riding the creator economy.
High-Quality Stocks for All Market Conditions
Market indices reached historic highs following Donald Trump’s presidential victory in November 2024, but the outlook for 2025 is clouded by new trade policies that could impact business confidence and growth.
While this has caused many investors to adopt a "fearful" wait-and-see approach, we’re leaning into our best ideas that can grow regardless of the political or macroeconomic climate. Take advantage of Mr. Market by checking out our Top 5 Growth Stocks for this month. This is a curated list of our High Quality stocks that have generated a market-beating return of 183% over the last five years (as of March 31st 2025).
Stocks that made our list in 2020 include now familiar names such as Nvidia (+1,545% between March 2020 and March 2025) as well as under-the-radar businesses like the once-micro-cap company Kadant (+351% five-year return). Find your next big winner with StockStory today.