Freight Delivery Company ArcBest (NASDAQ: ARCB) missed Wall Street’s revenue expectations in Q2 CY2025, with sales falling 5.2% year on year to $1.02 billion. Its non-GAAP profit of $1.36 per share was 7.1% below analysts’ consensus estimates.
Is now the time to buy ArcBest? Find out by accessing our full research report, it’s free.
ArcBest (ARCB) Q2 CY2025 Highlights:
- Revenue: $1.02 billion vs analyst estimates of $1.05 billion (5.2% year-on-year decline, 2.8% miss)
- Adjusted EPS: $1.36 vs analyst expectations of $1.46 (7.1% miss)
- Adjusted EBITDA: $80.98 million vs analyst estimates of $83.01 million (7.9% margin, 2.4% miss)
- Operating Margin: 3.6%, in line with the same quarter last year
- Free Cash Flow Margin: 7.9%, similar to the same quarter last year
- Sales Volumes rose 5.6% year on year (-4.8% in the same quarter last year)
- Market Capitalization: $1.88 billion
“Despite ongoing macroeconomic challenges, I commend our team for their continued commitment to meeting customer needs and achieving solid results,” said Judy R. McReynolds, ArcBest Chairman and CEO.
Company Overview
Historically owning furniture, banking, and other subsidiaries, ArcBest (NASDAQ: ARCB) offers full-truckload, less-than-truckload, and intermodal deliveries of freight.
Revenue Growth
Reviewing a company’s long-term sales performance reveals insights into its quality. Any business can put up a good quarter or two, but many enduring ones grow for years. Over the last five years, ArcBest grew its sales at a mediocre 7.4% compounded annual growth rate. This fell short of our benchmark for the industrials sector and is a poor baseline for our analysis.
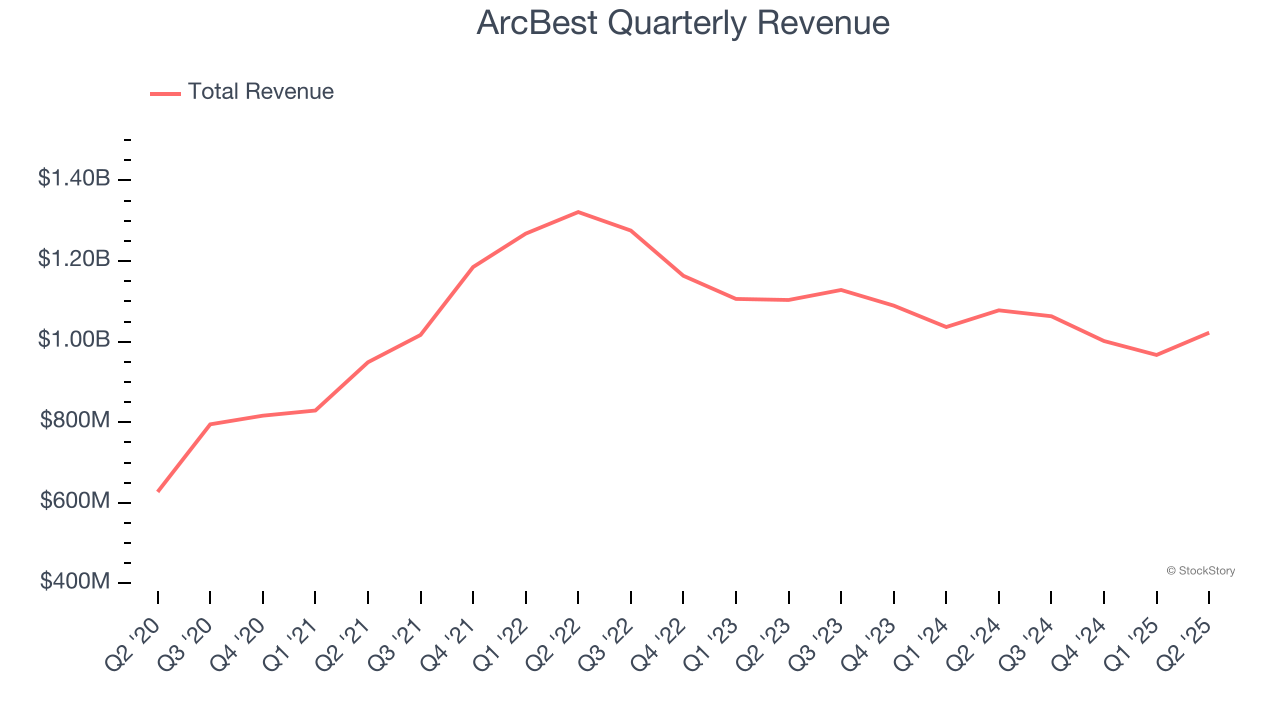
Long-term growth is the most important, but within industrials, a half-decade historical view may miss new industry trends or demand cycles. ArcBest’s performance shows it grew in the past but relinquished its gains over the last two years, as its revenue fell by 6.6% annually. ArcBest isn’t alone in its struggles as the Ground Transportation industry experienced a cyclical downturn, with many similar businesses observing lower sales at this time. 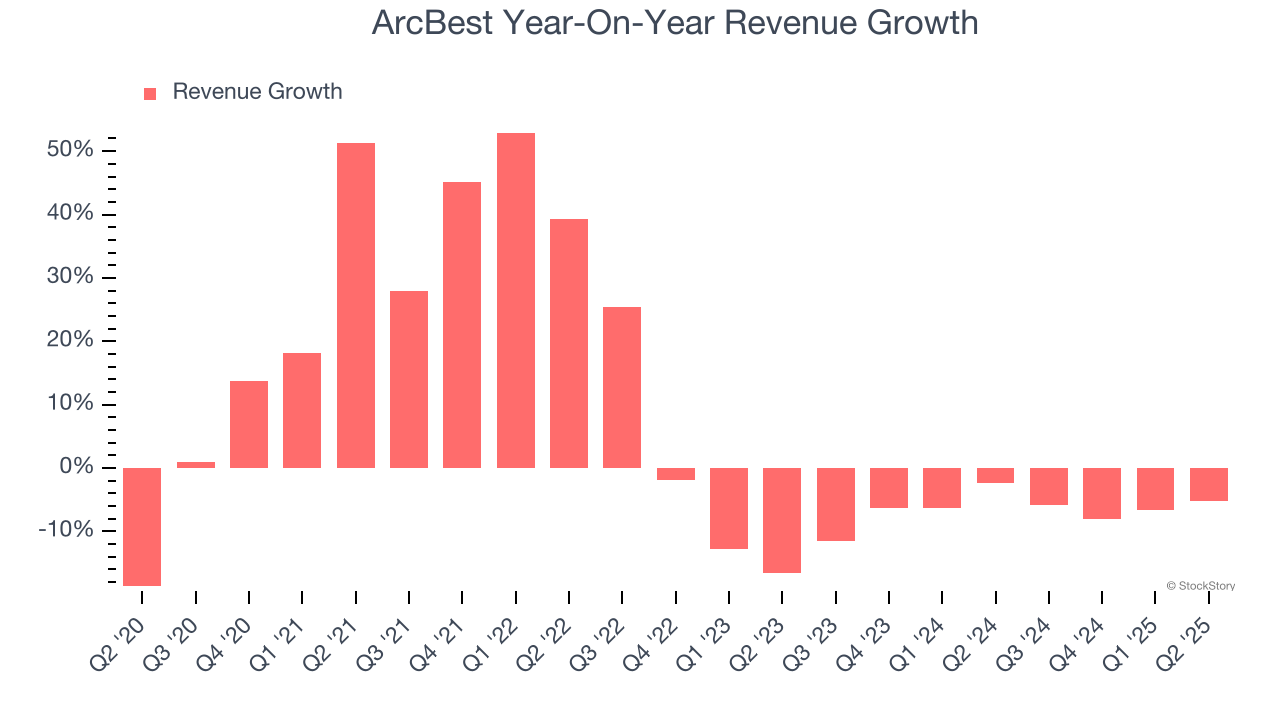
We can dig further into the company’s revenue dynamics by analyzing its number of units sold, which reached 21,051 in the latest quarter. Over the last two years, ArcBest’s units sold were flat. Because this number is better than its revenue growth, we can see the company’s average selling price decreased. 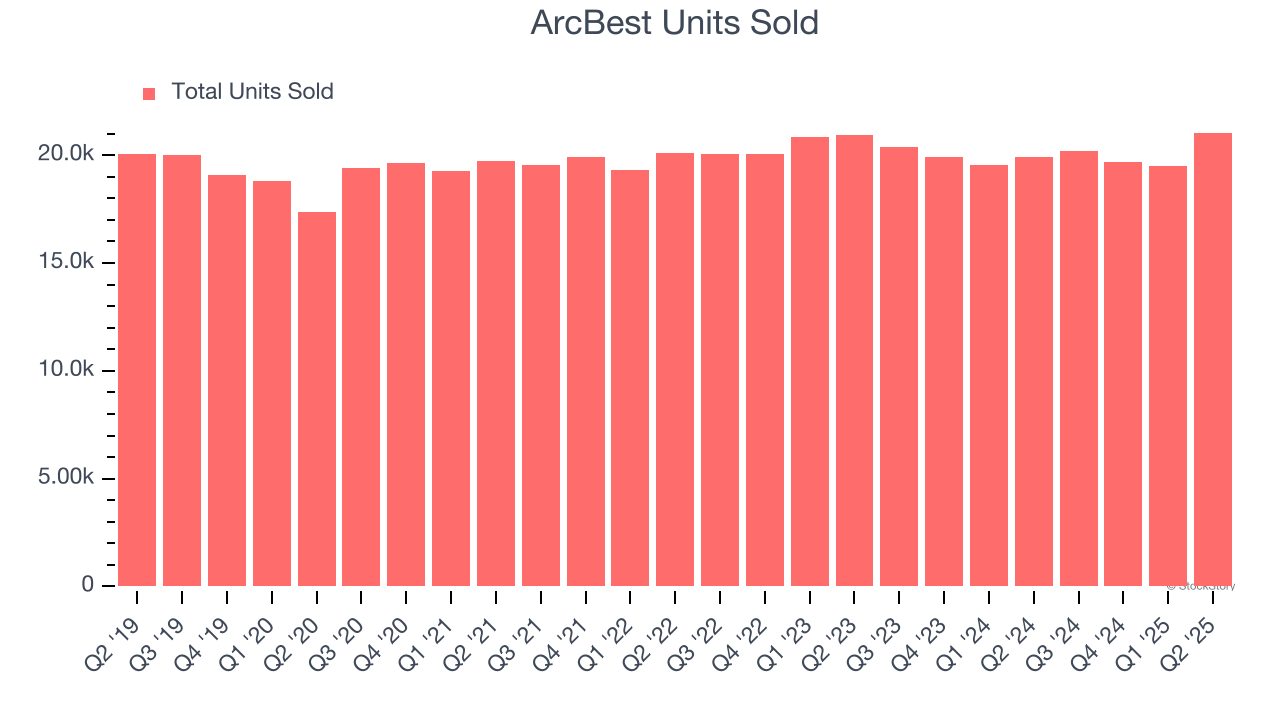
This quarter, ArcBest missed Wall Street’s estimates and reported a rather uninspiring 5.2% year-on-year revenue decline, generating $1.02 billion of revenue.
Looking ahead, sell-side analysts expect revenue to grow 4.5% over the next 12 months. Although this projection implies its newer products and services will fuel better top-line performance, it is still below the sector average.
Software is eating the world and there is virtually no industry left that has been untouched by it. That drives increasing demand for tools helping software developers do their jobs, whether it be monitoring critical cloud infrastructure, integrating audio and video functionality, or ensuring smooth content streaming. Click here to access a free report on our 3 favorite stocks to play this generational megatrend.
Operating Margin
ArcBest’s operating margin has risen over the last 12 months and averaged 5.7% over the last five years. The company’s higher efficiency is a breath of fresh air, but its suboptimal cost structure means it still sports paltry profitability for an industrials business. This result isn’t too surprising given its low gross margin as a starting point.
Looking at the trend in its profitability, ArcBest’s operating margin might fluctuated slightly but has generally stayed the same over the last five years. This raises questions about the company’s expense base because its revenue growth should have given it leverage on its fixed costs, resulting in better economies of scale and profitability. ArcBest’s performance was poor, but we noticed this is a broad theme as many similar Ground Transportation companies saw their margins fall (along with revenue, as mentioned above) because the cycle turned in the wrong direction.
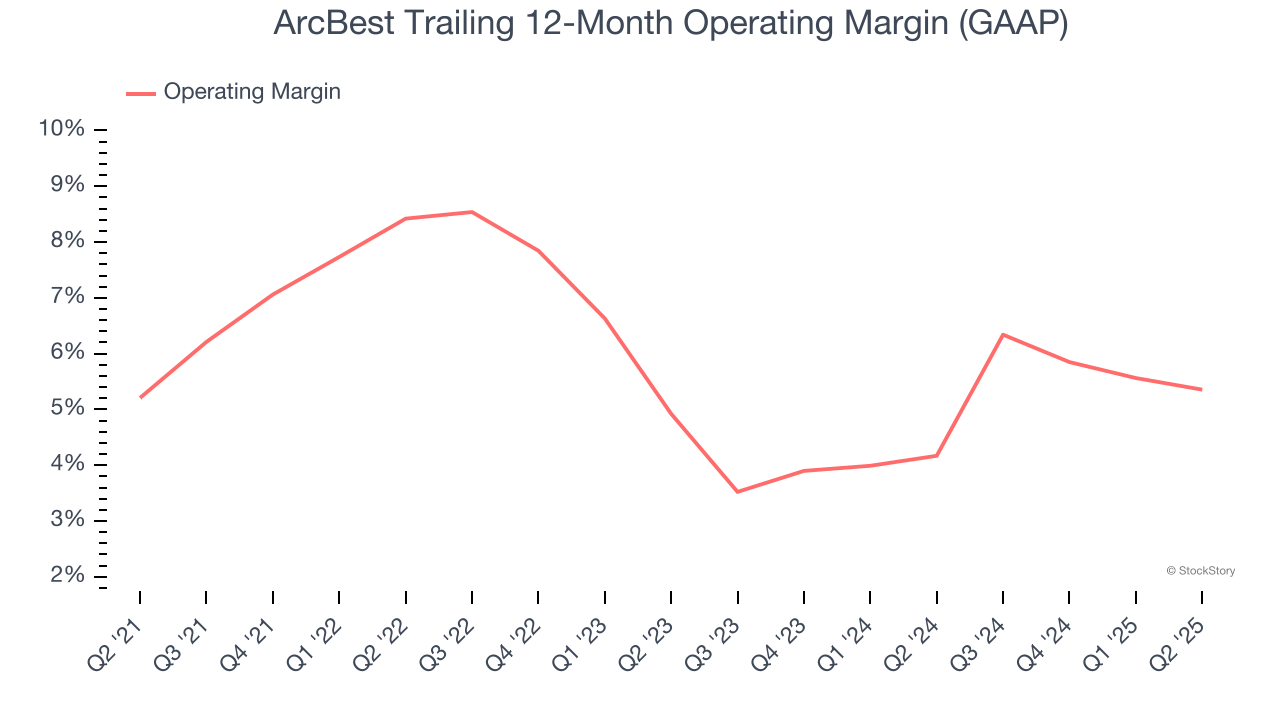
In Q2, ArcBest generated an operating margin profit margin of 3.6%, in line with the same quarter last year. This indicates the company’s cost structure has recently been stable.
Earnings Per Share
We track the long-term change in earnings per share (EPS) for the same reason as long-term revenue growth. Compared to revenue, however, EPS highlights whether a company’s growth is profitable.
ArcBest’s EPS grew at a remarkable 13.1% compounded annual growth rate over the last five years, higher than its 7.4% annualized revenue growth. However, this alone doesn’t tell us much about its business quality because its operating margin didn’t improve.
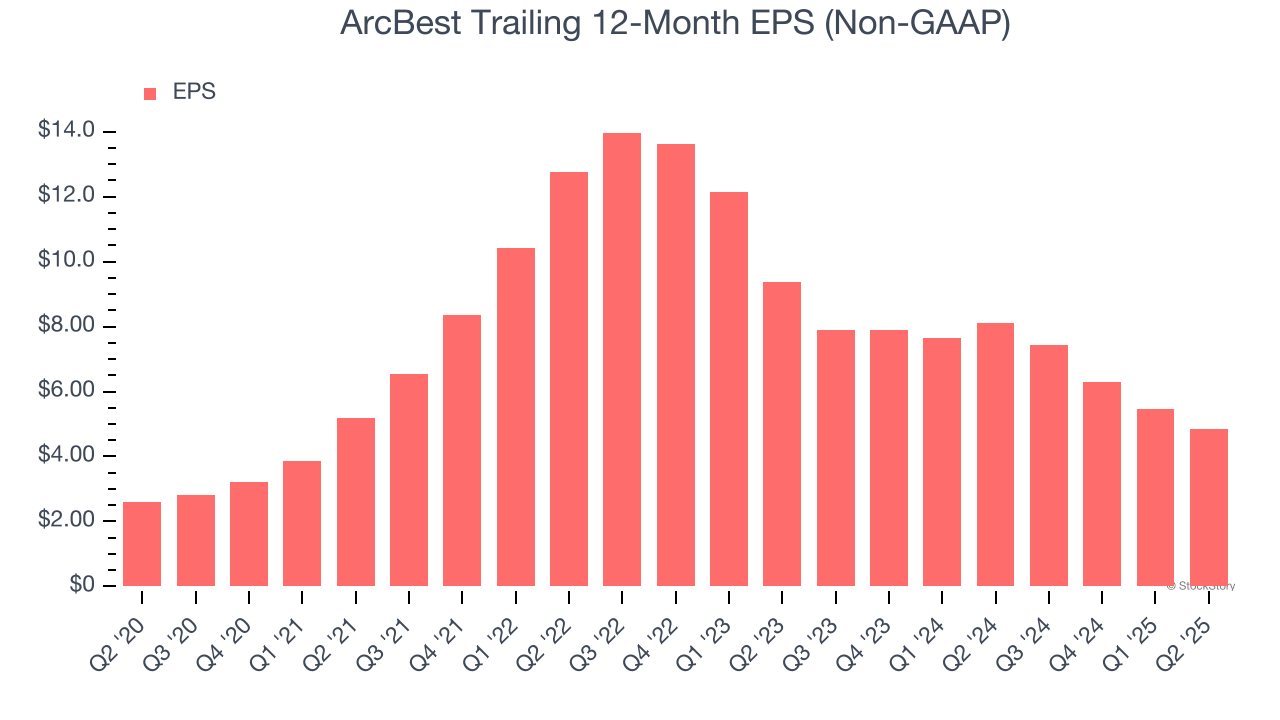
Diving into ArcBest’s quality of earnings can give us a better understanding of its performance. A five-year view shows that ArcBest has repurchased its stock, shrinking its share count by 12.2%. This tells us its EPS outperformed its revenue not because of increased operational efficiency but financial engineering, as buybacks boost per share earnings. 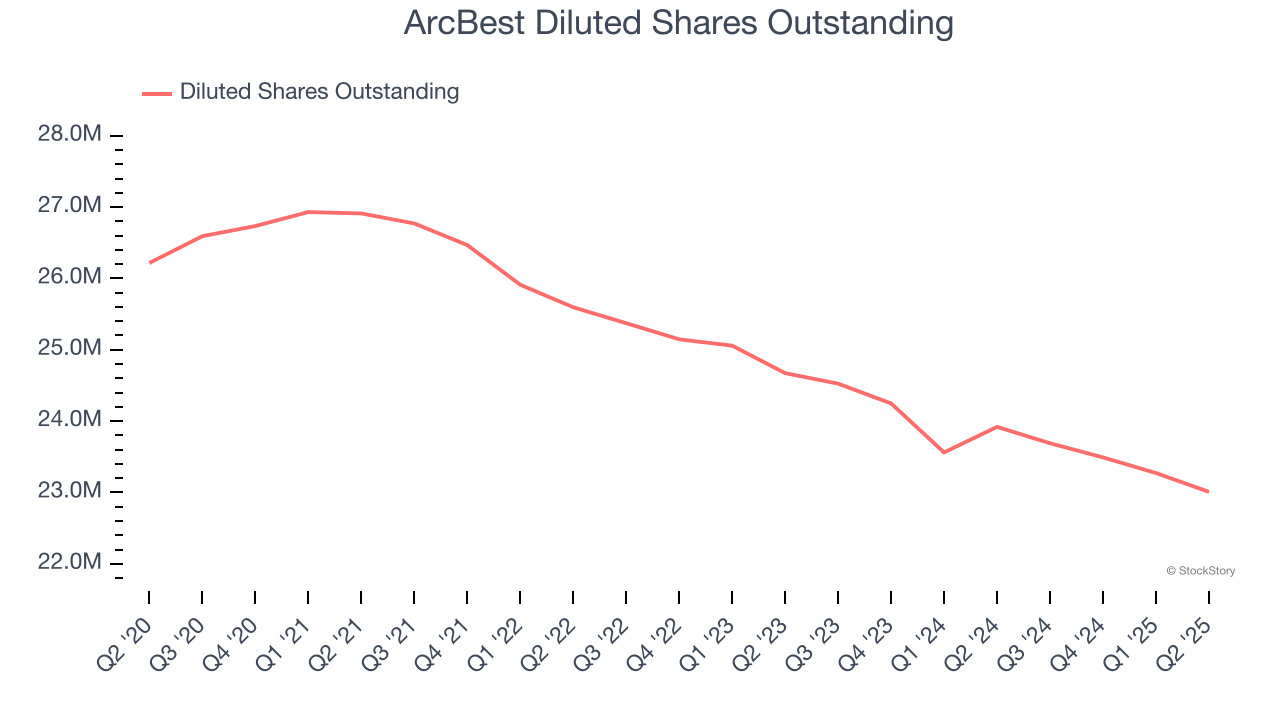
Like with revenue, we analyze EPS over a more recent period because it can provide insight into an emerging theme or development for the business.
For ArcBest, its two-year annual EPS declines of 28.1% mark a reversal from its (seemingly) healthy five-year trend. We hope ArcBest can return to earnings growth in the future.
In Q2, ArcBest reported EPS at $1.36, down from $1.98 in the same quarter last year. This print missed analysts’ estimates, but we care more about long-term EPS growth than short-term movements. Over the next 12 months, Wall Street expects ArcBest’s full-year EPS of $4.84 to grow 27.6%.
Key Takeaways from ArcBest’s Q2 Results
It was good to see ArcBest narrowly top analysts’ sales volume expectations this quarter. On the other hand, its revenue, EPS, and EBITDA fell short of Wall Street’s estimates. Overall, this quarter could have been better. The stock traded down 1.1% to $81 immediately after reporting.
ArcBest didn’t show it’s best hand this quarter, but does that create an opportunity to buy the stock right now? What happened in the latest quarter matters, but not as much as longer-term business quality and valuation, when deciding whether to invest in this stock. We cover that in our actionable full research report which you can read here, it’s free.