Semiconductor testing company FormFactor (NASDAQ: FORM) reported revenue ahead of Wall Street’s expectations in Q2 CY2025, but sales were flat year on year at $195.8 million. The company expects next quarter’s revenue to be around $200 million, close to analysts’ estimates. Its non-GAAP profit of $0.27 per share was 10% below analysts’ consensus estimates.
Is now the time to buy FormFactor? Find out by accessing our full research report, it’s free.
FormFactor (FORM) Q2 CY2025 Highlights:
- Revenue: $195.8 million vs analyst estimates of $189.4 million (flat year on year, 3.4% beat)
- Adjusted EPS: $0.27 vs analyst expectations of $0.30 (10% miss)
- Adjusted Operating Income: $22.85 million vs analyst estimates of $23.94 million (11.7% margin, 4.6% miss)
- Revenue Guidance for Q3 CY2025 is $200 million at the midpoint, roughly in line with what analysts were expecting
- Adjusted EPS guidance for Q3 CY2025 is $0.25 at the midpoint, below analyst estimates of $0.33
- Operating Margin: 6.3%, down from 9% in the same quarter last year
- Free Cash Flow was -$47.1 million, down from $13.48 million in the same quarter last year
- Inventory Days Outstanding: 82, down from 94 in the previous quarter
- Market Capitalization: $2.67 billion
“FormFactor reported sequentially stronger second-quarter revenue that exceeded the high end of our outlook range, due to higher-than-anticipated growth in our probe-card business,” said Mike Slessor, CEO of FormFactor,
Company Overview
With customers across the foundry and fabless markets, FormFactor (NASDAQ: FORM) is a US-based provider of test and measurement technologies for semiconductors.
Revenue Growth
A company’s long-term performance is an indicator of its overall quality. Any business can experience short-term success, but top-performing ones enjoy sustained growth for years. Regrettably, FormFactor’s sales grew at a sluggish 3.7% compounded annual growth rate over the last five years. This was below our standard for the semiconductor sector and is a rough starting point for our analysis. Semiconductors are a cyclical industry, and long-term investors should be prepared for periods of high growth followed by periods of revenue contractions.
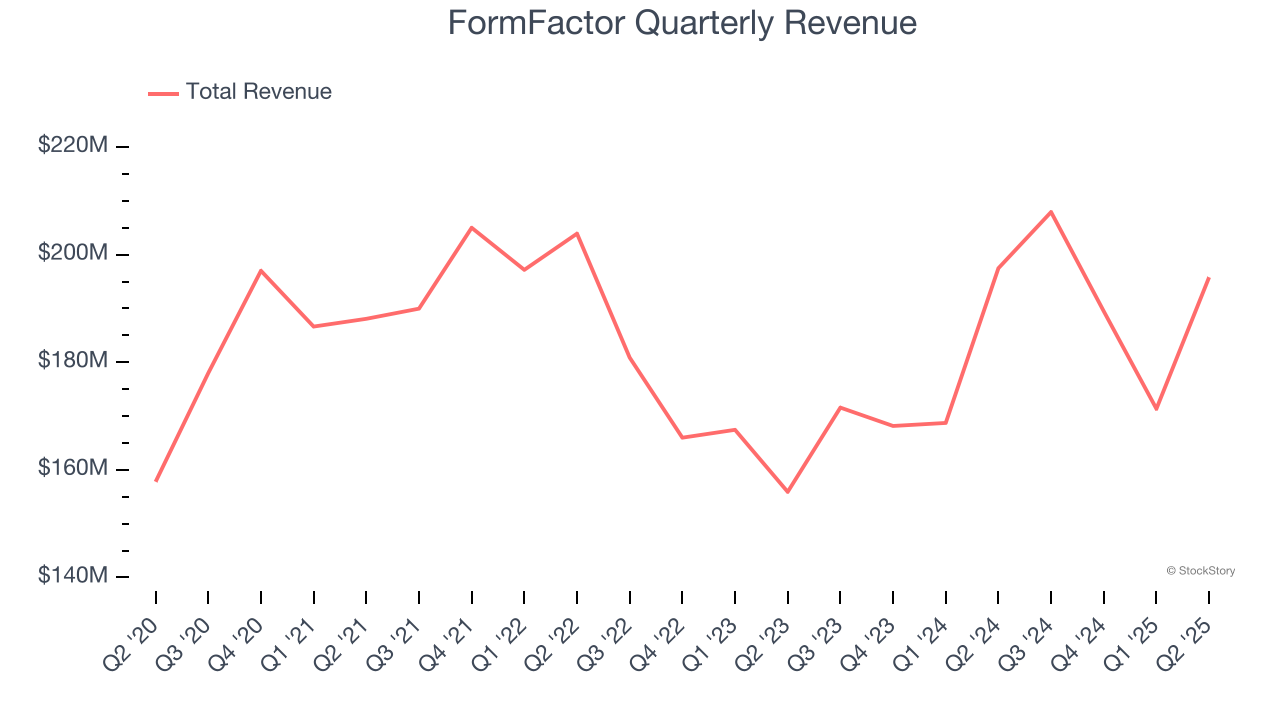
We at StockStory place the most emphasis on long-term growth, but within semiconductors, a half-decade historical view may miss new demand cycles or industry trends like AI. FormFactor’s annualized revenue growth of 6.8% over the last two years is above its five-year trend, suggesting its demand recently accelerated. 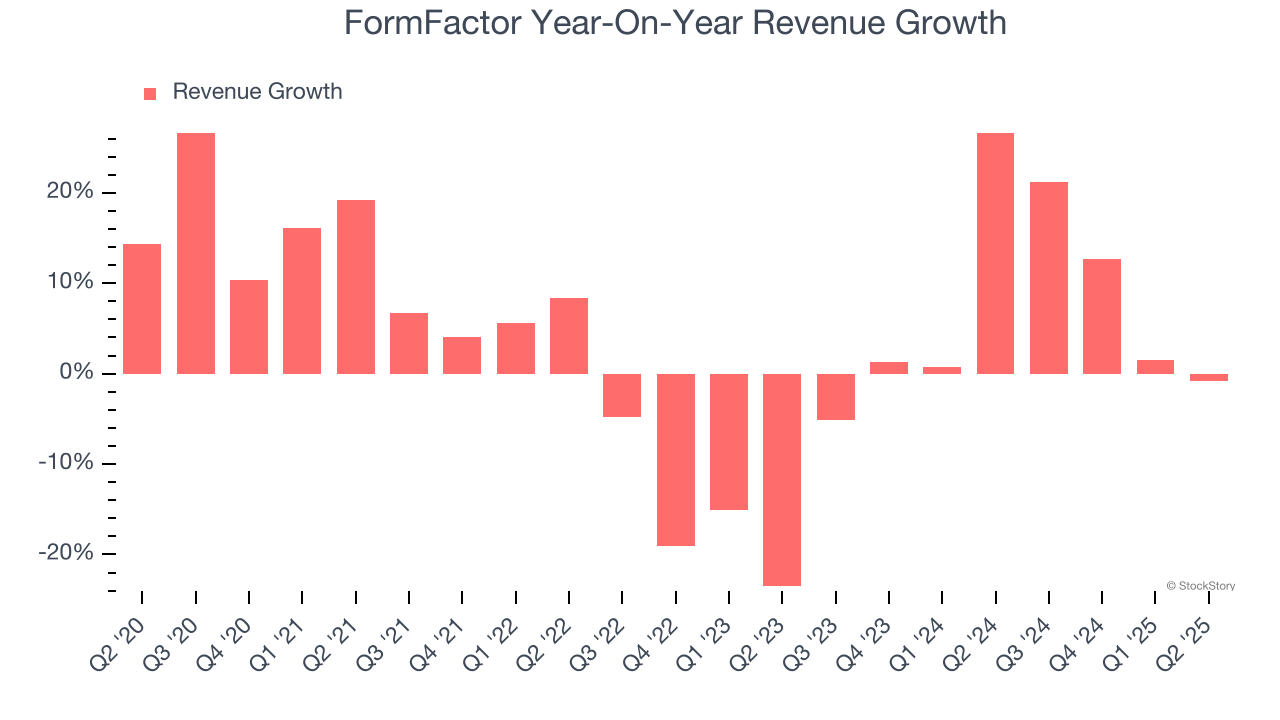
This quarter, FormFactor’s $195.8 million of revenue was flat year on year but beat Wall Street’s estimates by 3.4%. Despite the beat, this was its third consecutive quarter of decelerating growth, indicating a potential cyclical downturn. Company management is currently guiding for a 3.8% year-on-year decline in sales next quarter.
Looking further ahead, sell-side analysts expect revenue to grow 4.6% over the next 12 months, a slight deceleration versus the last two years. This projection doesn't excite us and implies its products and services will see some demand headwinds.
Here at StockStory, we certainly understand the potential of thematic investing. Diverse winners from Microsoft (MSFT) to Alphabet (GOOG), Coca-Cola (KO) to Monster Beverage (MNST) could all have been identified as promising growth stories with a megatrend driving the growth. So, in that spirit, we’ve identified a relatively under-the-radar profitable growth stock benefiting from the rise of AI, available to you FREE via this link.
Product Demand & Outstanding Inventory
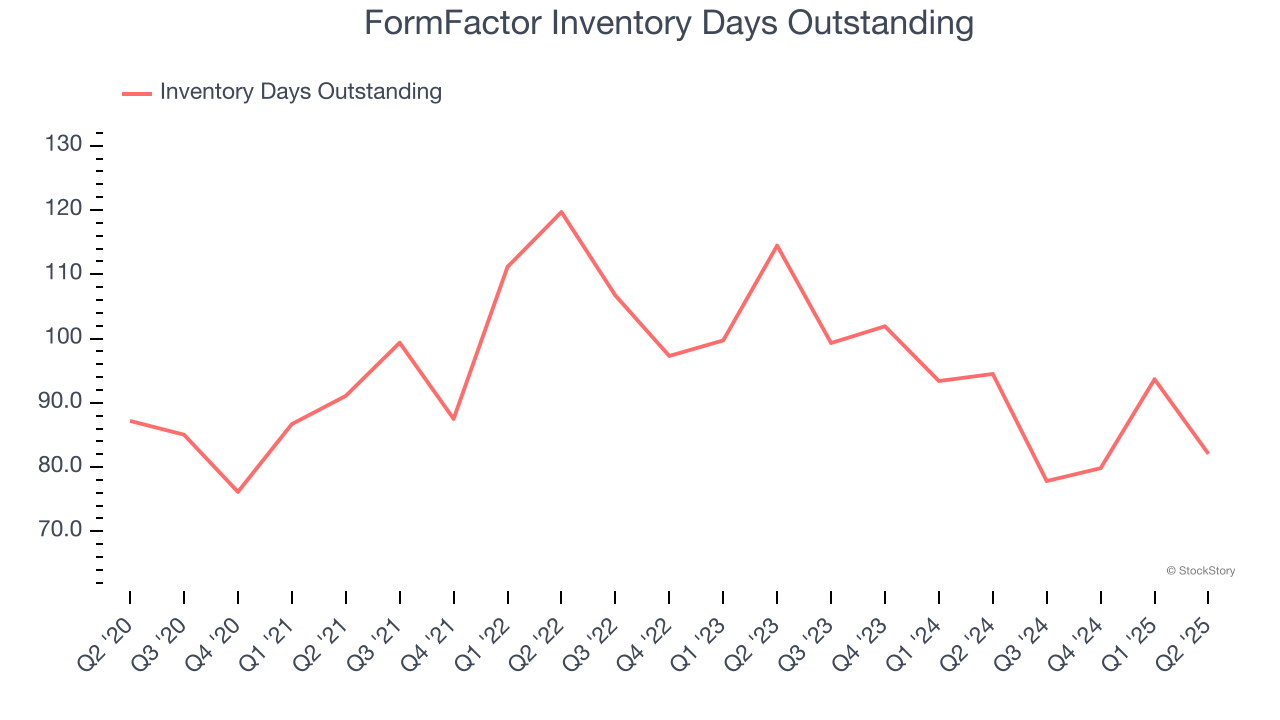
Days Inventory Outstanding (DIO) is an important metric for chipmakers, as it reflects a business’ capital intensity and the cyclical nature of semiconductor supply and demand. In a tight supply environment, inventories tend to be stable, allowing chipmakers to exert pricing power. Steadily increasing DIO can be a warning sign that demand is weak, and if inventories continue to rise, the company may have to downsize production.
This quarter, FormFactor’s DIO came in at 82, which is 13 days below its five-year average. At the moment, these numbers show no indication of an excessive inventory buildup.
Key Takeaways from FormFactor’s Q2 Results
We were impressed by FormFactor’s strong improvement in inventory levels. We were also happy its revenue outperformed Wall Street’s estimates. On the other hand, its EPS missed and its adjusted operating income fell short of Wall Street’s estimates. Overall, this was a softer quarter. The stock traded down 16% to $28.91 immediately following the results.
FormFactor didn’t show it’s best hand this quarter, but does that create an opportunity to buy the stock right now? When making that decision, it’s important to consider its valuation, business qualities, as well as what has happened in the latest quarter. We cover that in our actionable full research report which you can read here, it’s free.