
Hospitality and casino entertainment company MGM Resorts (NYSE: MGM) beat Wall Street’s revenue expectations in Q2 CY2025, with sales up 1.8% year on year to $4.40 billion. Its non-GAAP profit of $0.79 per share was 42.7% above analysts’ consensus estimates.
Is now the time to buy MGM Resorts? Find out by accessing our full research report, it’s free.
MGM Resorts (MGM) Q2 CY2025 Highlights:
- Revenue: $4.40 billion vs analyst estimates of $4.32 billion (1.8% year-on-year growth, 1.9% beat)
- Adjusted EPS: $0.79 vs analyst estimates of $0.55 (42.7% beat)
- Adjusted EBITDA: $647.5 million vs analyst estimates of $1.17 billion (14.7% margin, 44.6% miss)
- Operating Margin: 9.2%, in line with the same quarter last year
- Market Capitalization: $10.18 billion
Company Overview
Operating several properties on the Las Vegas Strip, MGM Resorts (NYSE: MGM) is a global hospitality and entertainment company known for its resorts and casinos.
Revenue Growth
A company’s long-term sales performance is one signal of its overall quality. Any business can put up a good quarter or two, but many enduring ones grow for years. Over the last five years, MGM Resorts grew its sales at a 13.7% annual rate. Although this growth is acceptable on an absolute basis, it fell short of our standards for the consumer discretionary sector, which enjoys a number of secular tailwinds.
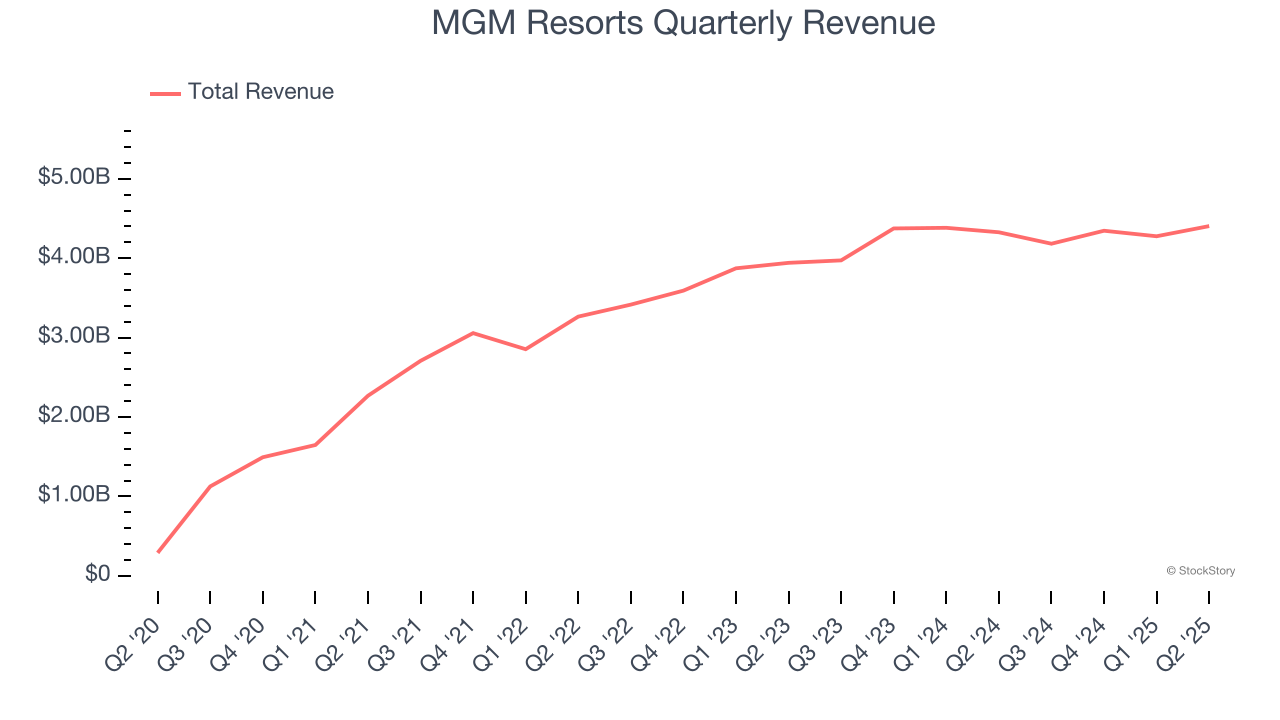
We at StockStory place the most emphasis on long-term growth, but within consumer discretionary, a stretched historical view may miss a company riding a successful new product or trend. MGM Resorts’s recent performance shows its demand has slowed as its annualized revenue growth of 7.8% over the last two years was below its five-year trend. Note that COVID hurt MGM Resorts’s business in 2020 and part of 2021, and it bounced back in a big way thereafter. 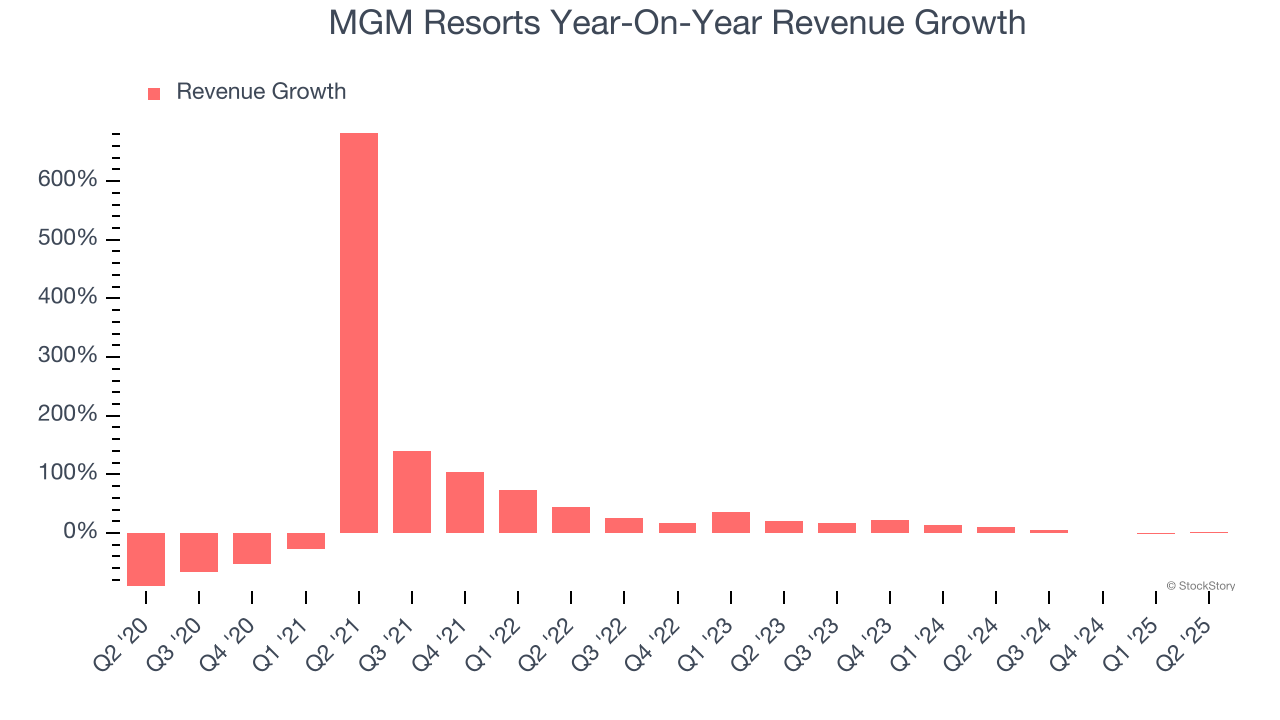
MGM Resorts also breaks out the revenue for its three most important segments: Casino, Hotel, and Dining, which are 52.9%, 19.5%, and 17.7% of revenue. Over the last two years, MGM Resorts’s revenues in all three segments increased. Its Casino revenue (Poker, sports betting) averaged year-on-year growth of 16.2% while its Hotel (overnight bookings) and Dining (food and beverage) revenues averaged 2.7% and 2.8%.
This quarter, MGM Resorts reported modest year-on-year revenue growth of 1.8% but beat Wall Street’s estimates by 1.9%.
Looking ahead, sell-side analysts expect revenue to remain flat over the next 12 months, a deceleration versus the last two years. This projection doesn't excite us and indicates its products and services will face some demand challenges.
Unless you’ve been living under a rock, it should be obvious by now that generative AI is going to have a huge impact on how large corporations do business. While Nvidia and AMD are trading close to all-time highs, we prefer a lesser-known (but still profitable) stock benefiting from the rise of AI. Click here to access our free report one of our favorites growth stories.
Operating Margin
Operating margin is a key measure of profitability. Think of it as net income - the bottom line - excluding the impact of taxes and interest on debt, which are less connected to business fundamentals.
MGM Resorts’s operating margin has been trending down over the last 12 months and averaged 9% over the last two years. The company’s profitability was mediocre for a consumer discretionary business and shows it couldn’t pass its higher operating expenses onto its customers.
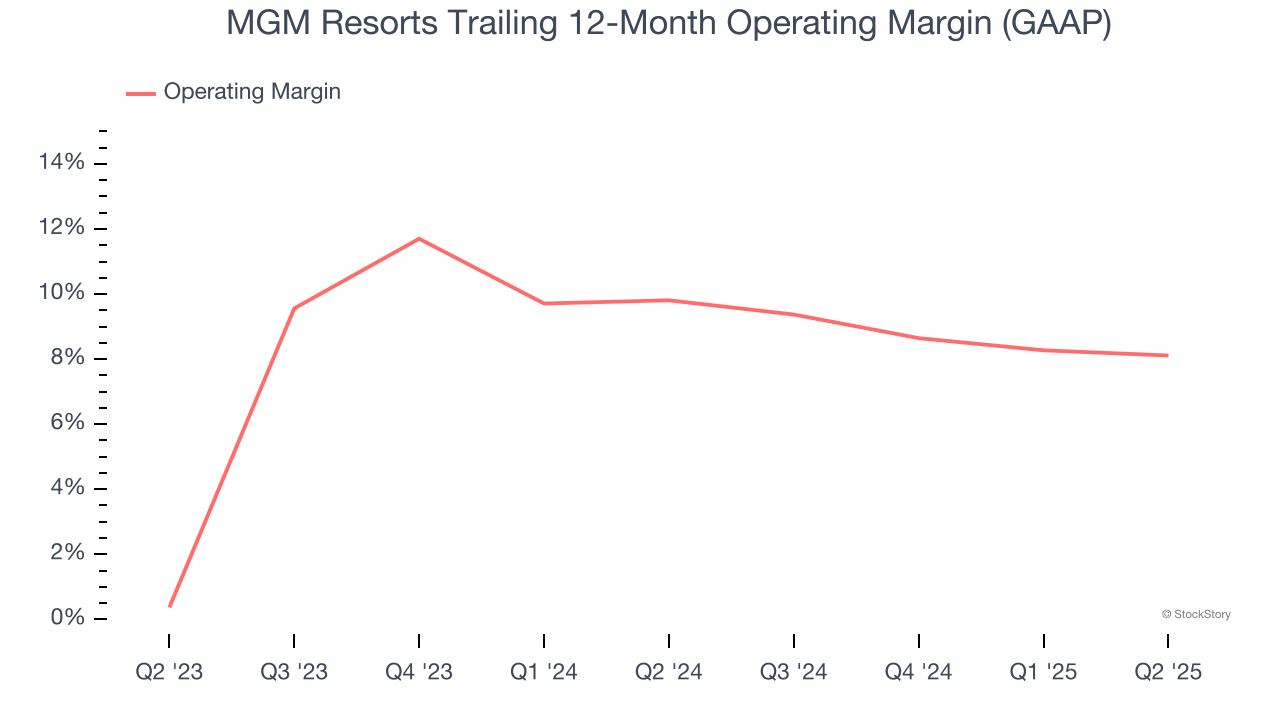
This quarter, MGM Resorts generated an operating margin profit margin of 9.2%, in line with the same quarter last year. This indicates the company’s overall cost structure has been relatively stable.
Earnings Per Share
We track the long-term change in earnings per share (EPS) for the same reason as long-term revenue growth. Compared to revenue, however, EPS highlights whether a company’s growth is profitable.
MGM Resorts’s full-year EPS flipped from negative to positive over the last five years. This is encouraging and shows it’s at a critical moment in its life.
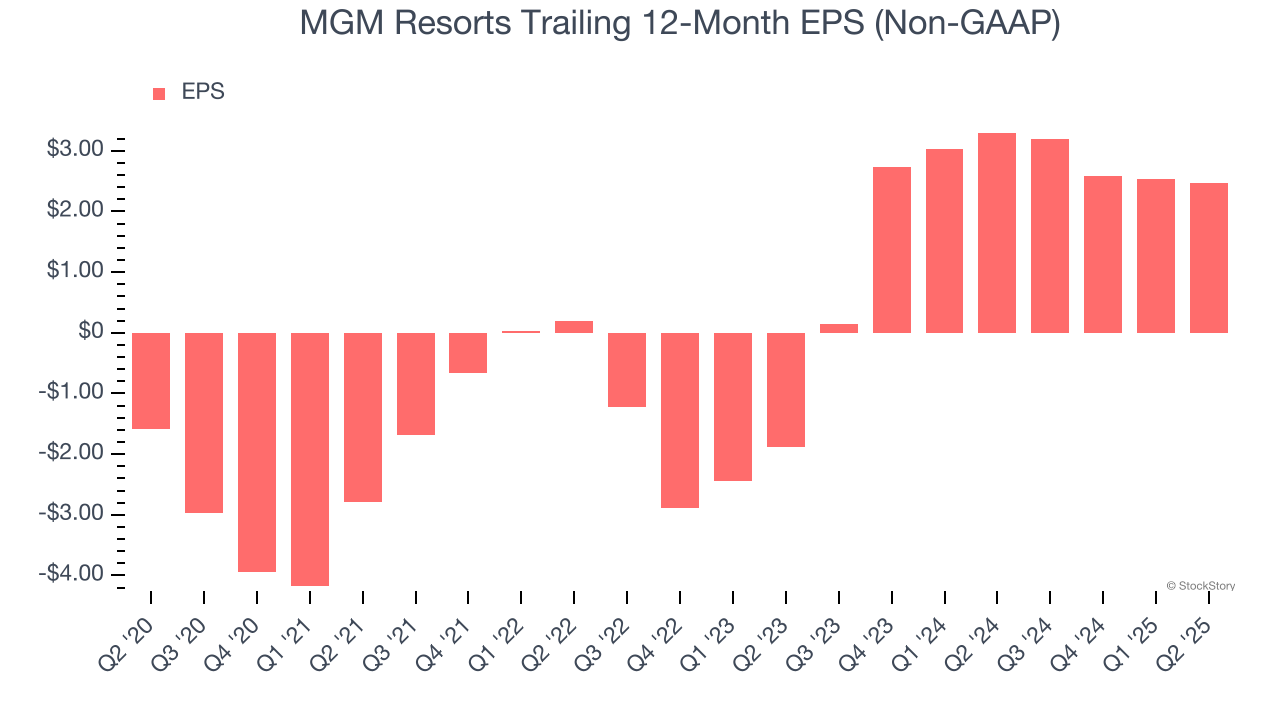
In Q2, MGM Resorts reported adjusted EPS at $0.79, down from $0.86 in the same quarter last year. Despite falling year on year, this print easily cleared analysts’ estimates. Over the next 12 months, Wall Street expects MGM Resorts’s full-year EPS of $2.47 to shrink by 4.8%.
Key Takeaways from MGM Resorts’s Q2 Results
We were impressed by how significantly MGM Resorts blew past analysts’ EPS expectations this quarter. We were also happy its revenue outperformed Wall Street’s estimates. On the other hand, its EBITDA missed and its Casino revenue fell short of Wall Street’s estimates. Zooming out, we think this was a mixed quarter. The market seemed to be hoping for more, and the stock traded down 1.9% to $37.20 immediately after reporting.
Big picture, is MGM Resorts a buy here and now? We think that the latest quarter is only one piece of the longer-term business quality puzzle. Quality, when combined with valuation, can help determine if the stock is a buy. We cover that in our actionable full research report which you can read here, it’s free.