Real estate services firm Newmark (NASDAQ: NMRK) reported Q2 CY2025 results topping the market’s revenue expectations, with sales up 19.9% year on year to $759.1 million. The company’s full-year revenue guidance of $3.15 billion at the midpoint came in 2.7% above analysts’ estimates. Its non-GAAP profit of $0.31 per share was 17% above analysts’ consensus estimates.
Is now the time to buy Newmark? Find out by accessing our full research report, it’s free.
Newmark (NMRK) Q2 CY2025 Highlights:
- Revenue: $759.1 million vs analyst estimates of $685.9 million (19.9% year-on-year growth, 10.7% beat)
- Adjusted EPS: $0.31 vs analyst estimates of $0.27 (17% beat)
- Adjusted EBITDA: $114 million vs analyst estimates of $101 million (15% margin, 12.8% beat)
- The company lifted its revenue guidance for the full year to $3.15 billion at the midpoint from $3 billion, a 5% increase
- Management raised its full-year Adjusted EPS guidance to $1.52 at the midpoint, a 4.8% increase
- EBITDA guidance for the full year is $548 million at the midpoint, above analyst estimates of $525.2 million
- Operating Margin: 5.6%, in line with the same quarter last year
- Free Cash Flow was -$386.2 million compared to -$267.8 million in the same quarter last year
- Market Capitalization: $2.66 billion
Company Overview
Founded in 1929, Newmark (NASDAQ: NMRK) provides commercial real estate services, including leasing advisory, global corporate services, investment sales and capital markets, property and facilities management, valuation and advisory, and consulting.
Revenue Growth
A company’s long-term performance is an indicator of its overall quality. Any business can experience short-term success, but top-performing ones enjoy sustained growth for years. Unfortunately, Newmark’s 7.4% annualized revenue growth over the last five years was sluggish. This fell short of our benchmark for the consumer discretionary sector and is a tough starting point for our analysis.
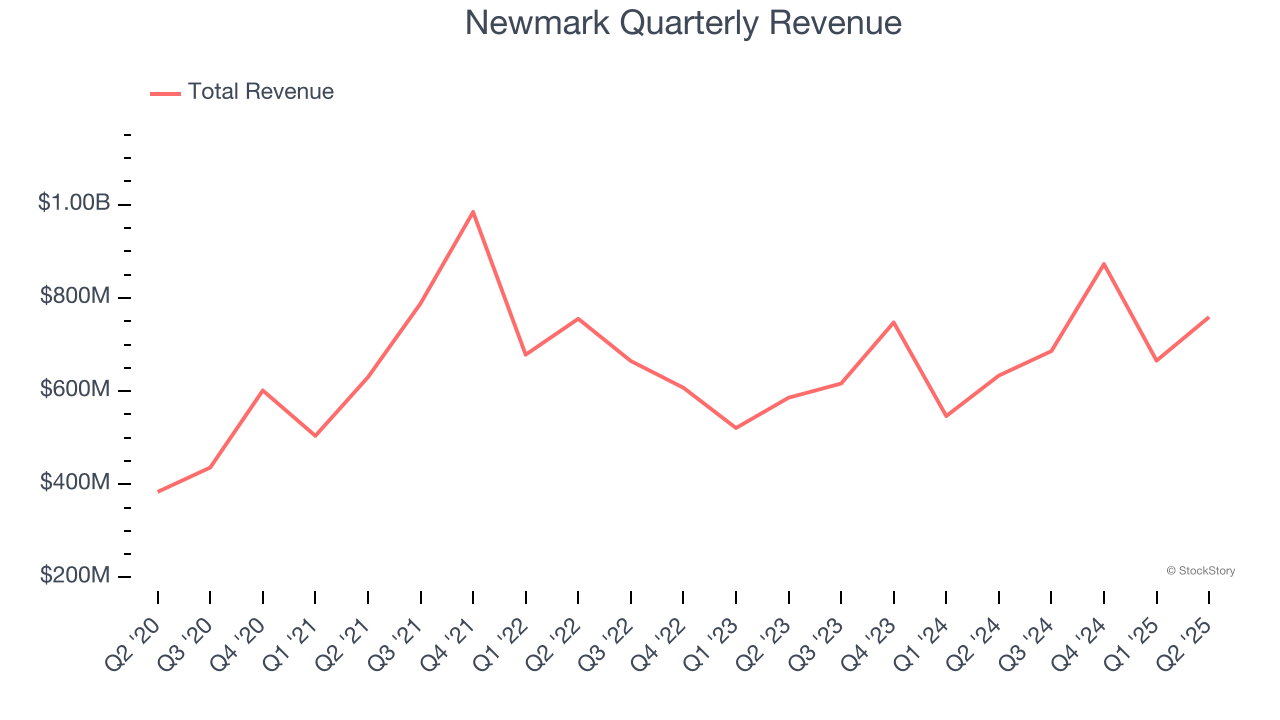
Long-term growth is the most important, but within consumer discretionary, product cycles are short and revenue can be hit-driven due to rapidly changing trends and consumer preferences. Newmark’s annualized revenue growth of 12% over the last two years is above its five-year trend, but we were still disappointed by the results. 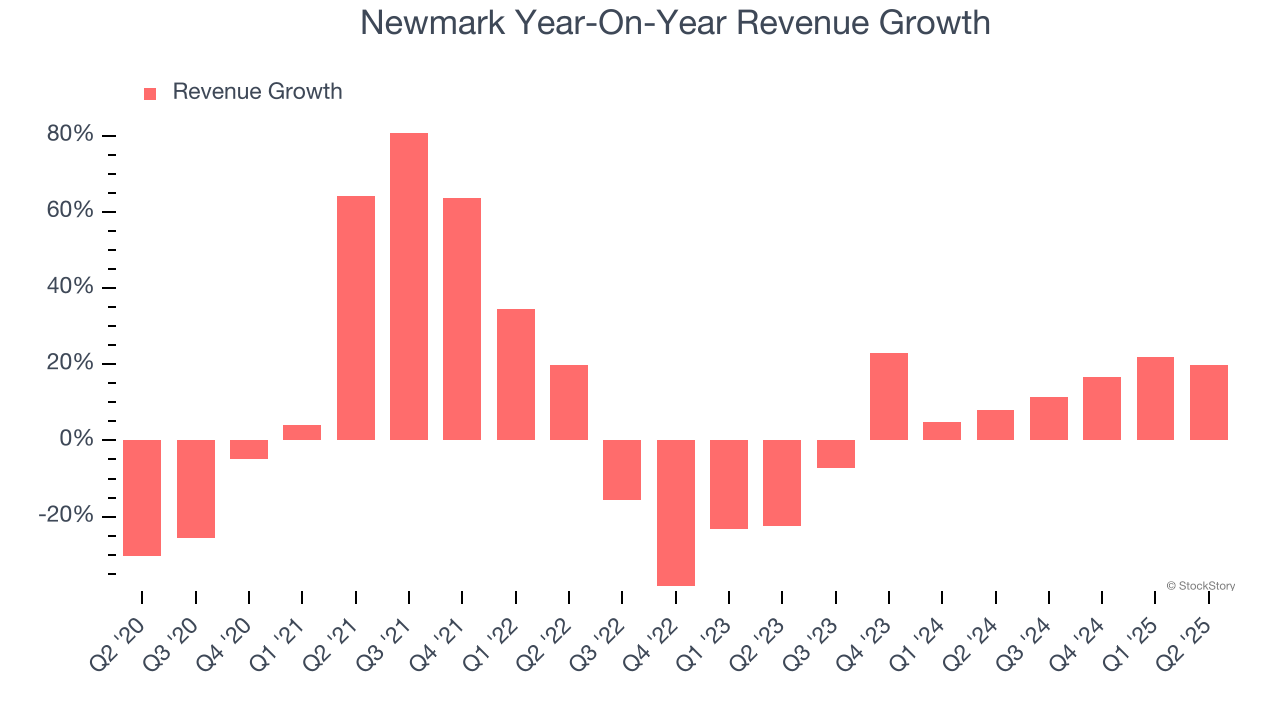
Newmark also breaks out the revenue for its three most important segments: Management, Leasing, and Investment Sales, which are 39.3%, 31.3%, and 29.4% of revenue. Over the last two years, Newmark’s revenues in all three segments increased. Its Management revenue (property management) averaged year-on-year growth of 14.4% while its Leasing (sourcing tenants) and Investment Sales (financial advisory) revenues averaged 7.8% and 25.3%.
This quarter, Newmark reported year-on-year revenue growth of 19.9%, and its $759.1 million of revenue exceeded Wall Street’s estimates by 10.7%.
Looking ahead, sell-side analysts expect revenue to grow 5.6% over the next 12 months, a deceleration versus the last two years. This projection doesn't excite us and indicates its products and services will see some demand headwinds.
Unless you’ve been living under a rock, it should be obvious by now that generative AI is going to have a huge impact on how large corporations do business. While Nvidia and AMD are trading close to all-time highs, we prefer a lesser-known (but still profitable) stock benefiting from the rise of AI. Click here to access our free report one of our favorites growth stories.
Operating Margin
Newmark’s operating margin has been trending up over the last 12 months and averaged 5% over the last two years. The company’s higher efficiency is a breath of fresh air, but its suboptimal cost structure means it still sports lousy profitability for a consumer discretionary business.
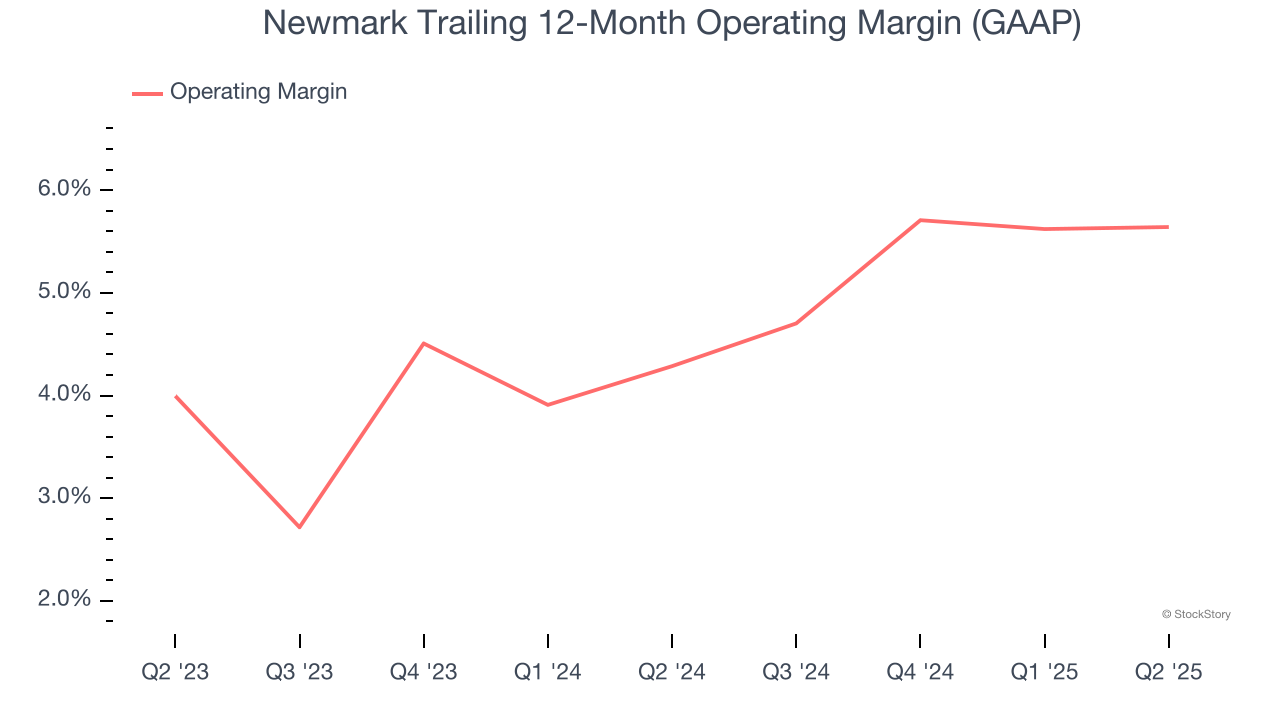
This quarter, Newmark generated an operating margin profit margin of 5.6%, in line with the same quarter last year. This indicates the company’s overall cost structure has been relatively stable.
Earnings Per Share
We track the long-term change in earnings per share (EPS) for the same reason as long-term revenue growth. Compared to revenue, however, EPS highlights whether a company’s growth is profitable.
Newmark’s EPS grew at a weak 1.3% compounded annual growth rate over the last five years, lower than its 7.4% annualized revenue growth. This tells us the company became less profitable on a per-share basis as it expanded.
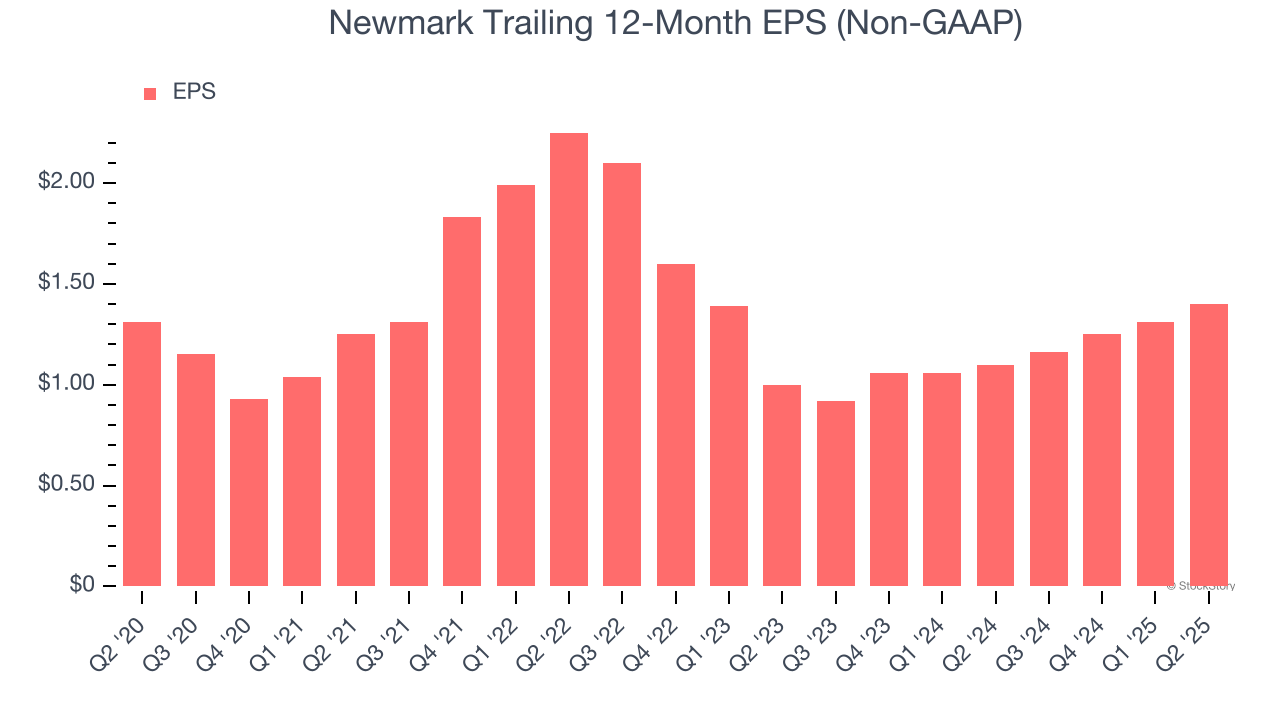
In Q2, Newmark reported EPS at $0.31, up from $0.22 in the same quarter last year. This print easily cleared analysts’ estimates, and shareholders should be content with the results. Over the next 12 months, Wall Street expects Newmark’s full-year EPS of $1.40 to grow 11%.
Key Takeaways from Newmark’s Q2 Results
This was a 'beat and raise' quarter. Specifically, we were impressed by how significantly Newmark blew past analysts’ revenue expectations this quarter. We were also glad its full-year revenue and EPS guidance both exceeded Wall Street’s estimates. Zooming out, we think this was a solid print. The stock traded up 7.4% to $15.54 immediately following the results.
Newmark may have had a good quarter, but does that mean you should invest right now? When making that decision, it’s important to consider its valuation, business qualities, as well as what has happened in the latest quarter. We cover that in our actionable full research report which you can read here, it’s free.