Tanking company Scorpio Tankers (NYSE: STNG) reported Q2 CY2025 results beating Wall Street’s revenue expectations, but sales fell by 38.4% year on year to $230.2 million. Its GAAP profit of $1.53 per share was 46% above analysts’ consensus estimates.
Is now the time to buy Scorpio Tankers? Find out by accessing our full research report, it’s free.
Scorpio Tankers (STNG) Q2 CY2025 Highlights:
- Revenue: $230.2 million vs analyst estimates of $218.9 million (38.4% year-on-year decline, 5.1% beat)
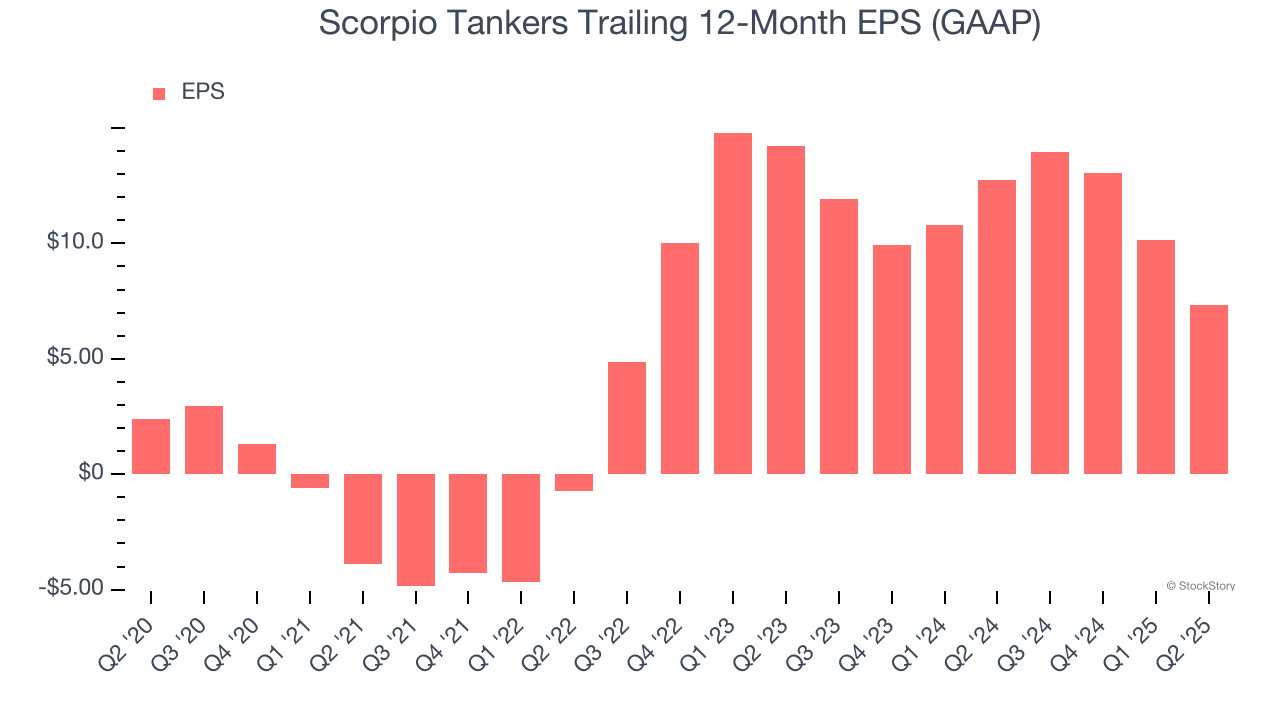
- EPS (GAAP): $1.53 vs analyst estimates of $1.05 (46% beat)
- Adjusted EBITDA: $144.5 million vs analyst estimates of $115.2 million (62.8% margin, 25.5% beat)
- Operating Margin: 34.3%, down from 67.9% in the same quarter last year
- Free Cash Flow Margin: 46.4%, down from 69.3% in the same quarter last year
- Market Capitalization: $2.13 billion
Company Overview
Operating one of the youngest fleets in the industry, Scorpio Tankers (NYSE: STNG) is an international provider of marine transportation services, specializing in the shipment of refined petroleum.
Revenue Growth
Reviewing a company’s long-term sales performance reveals insights into its quality. Any business can put up a good quarter or two, but the best consistently grow over the long haul. Over the last five years, Scorpio Tankers’s demand was weak and its revenue declined by 1.3% per year. This wasn’t a great result and suggests it’s a lower quality business.
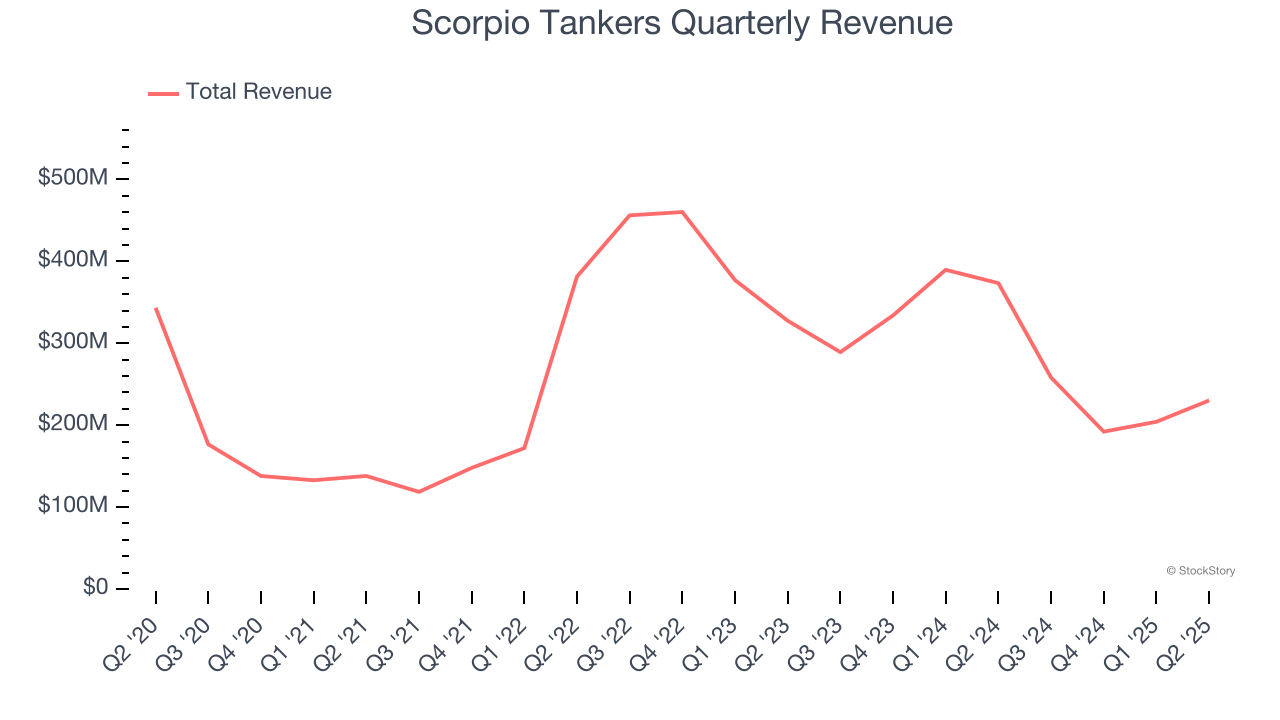
Long-term growth is the most important, but within industrials, a half-decade historical view may miss new industry trends or demand cycles. Scorpio Tankers’s recent performance shows its demand remained suppressed as its revenue has declined by 26.1% annually over the last two years. Scorpio Tankers isn’t alone in its struggles as the Marine Transportation industry experienced a cyclical downturn, with many similar businesses observing lower sales at this time. 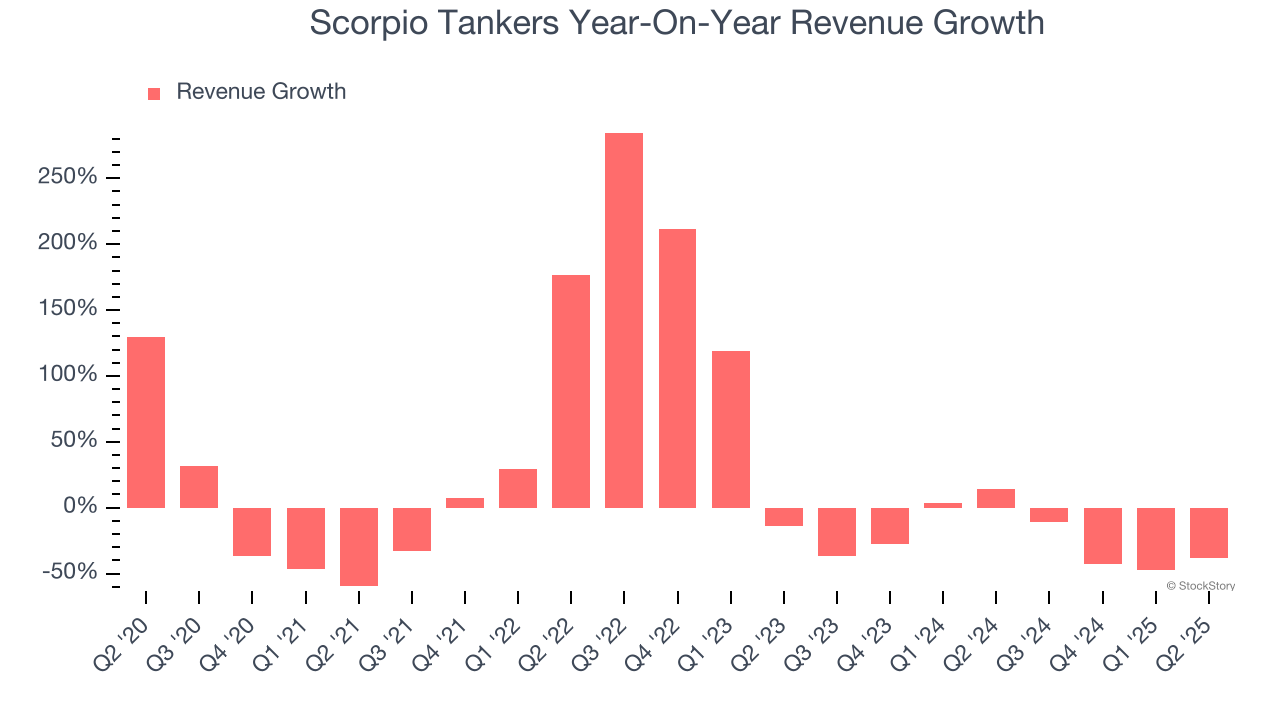
This quarter, Scorpio Tankers’s revenue fell by 38.4% year on year to $230.2 million but beat Wall Street’s estimates by 5.1%.
Looking ahead, sell-side analysts expect revenue to grow 10.1% over the next 12 months, an improvement versus the last two years. This projection is commendable and implies its newer products and services will spur better top-line performance.
Software is eating the world and there is virtually no industry left that has been untouched by it. That drives increasing demand for tools helping software developers do their jobs, whether it be monitoring critical cloud infrastructure, integrating audio and video functionality, or ensuring smooth content streaming. Click here to access a free report on our 3 favorite stocks to play this generational megatrend.
Operating Margin
Scorpio Tankers has been a well-oiled machine over the last five years. It demonstrated elite profitability for an industrials business, boasting an average operating margin of 43.2%. This result isn’t surprising as its high gross margin gives it a favorable starting point.
Analyzing the trend in its profitability, Scorpio Tankers’s operating margin rose by 57.6 percentage points over the last five years. Its expansion was impressive, especially when considering the cycle turned in the wrong direction and most of its Marine Transportation peers observed plummeting revenue and margins.
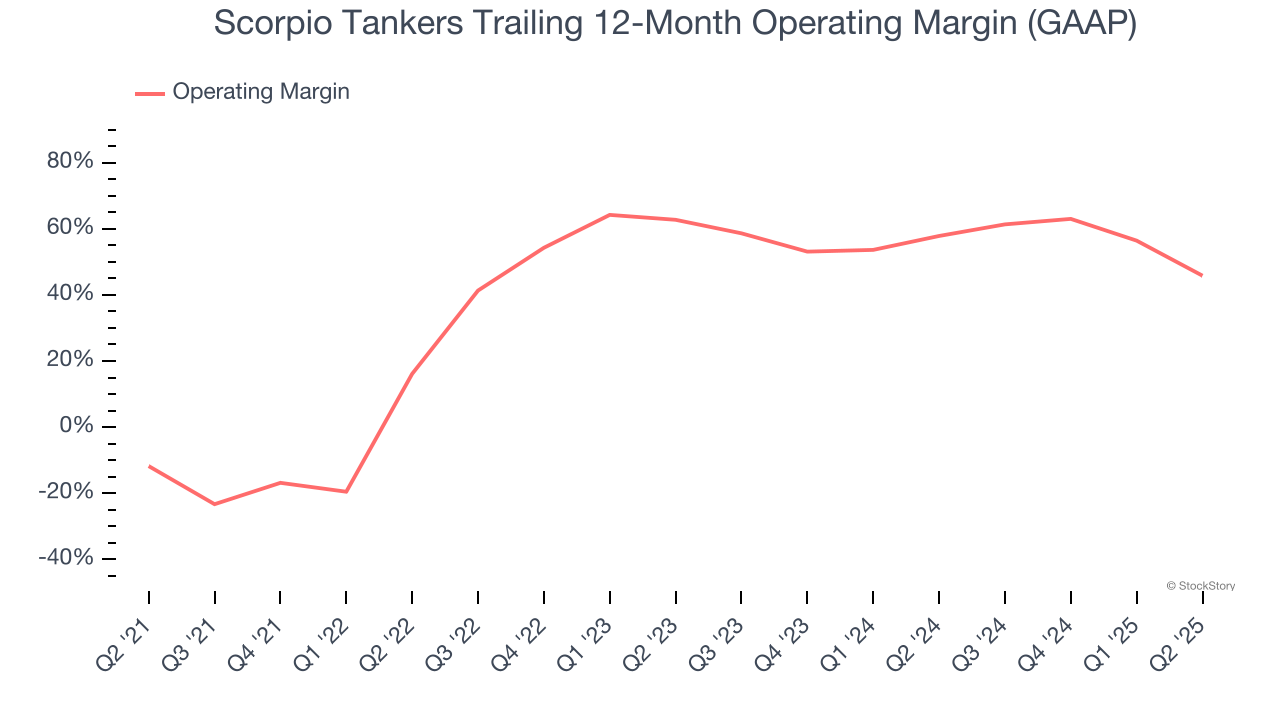
This quarter, Scorpio Tankers generated an operating margin profit margin of 34.3%, down 33.6 percentage points year on year. The contraction shows it was less efficient because its expenses increased relative to its revenue.
Earnings Per Share
Revenue trends explain a company’s historical growth, but the long-term change in earnings per share (EPS) points to the profitability of that growth – for example, a company could inflate its sales through excessive spending on advertising and promotions.
Scorpio Tankers’s EPS grew at an astounding 25.4% compounded annual growth rate over the last five years, higher than its 1.3% annualized revenue declines. This tells us management adapted its cost structure in response to a challenging demand environment.
We can take a deeper look into Scorpio Tankers’s earnings quality to better understand the drivers of its performance. As we mentioned earlier, Scorpio Tankers’s operating margin declined this quarter but expanded by 57.6 percentage points over the last five years. Its share count also shrank by 22.1%, and these factors together are positive signs for shareholders because improving profitability and share buybacks turbocharge EPS growth relative to revenue growth. 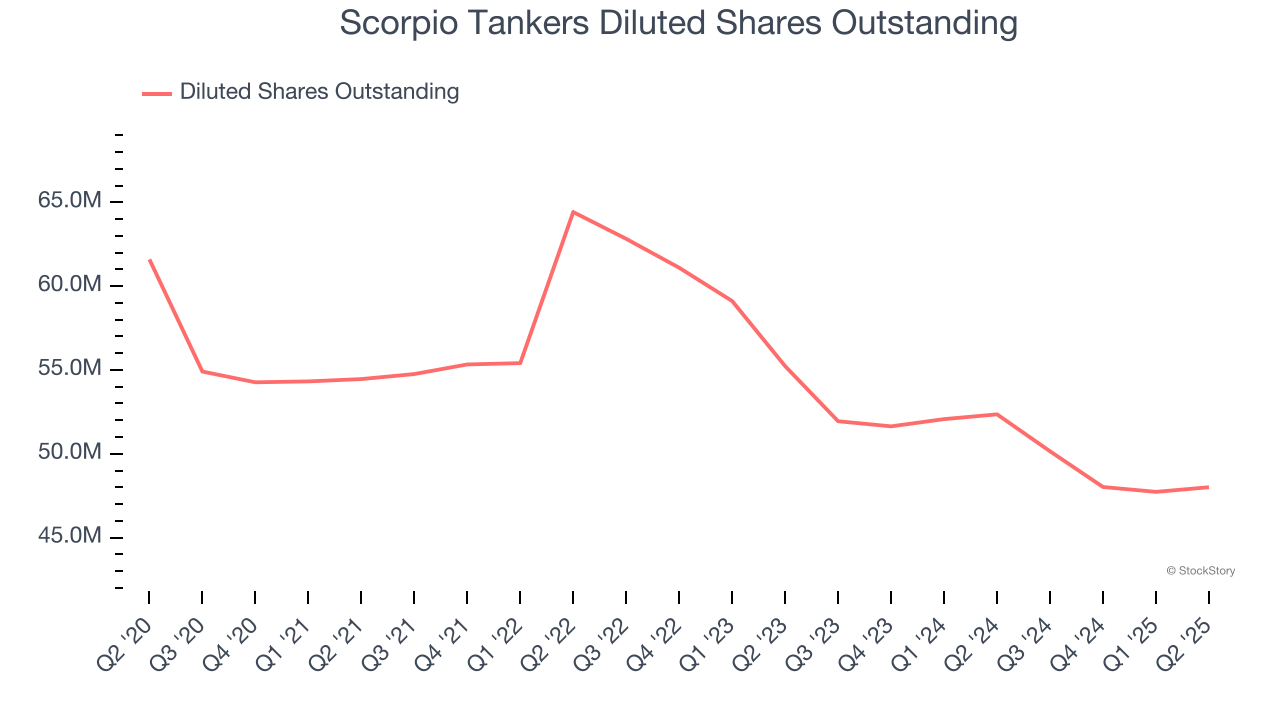
Like with revenue, we analyze EPS over a more recent period because it can provide insight into an emerging theme or development for the business.
For Scorpio Tankers, its two-year annual EPS declines of 28.2% mark a reversal from its (seemingly) healthy five-year trend. We hope Scorpio Tankers can return to earnings growth in the future.
In Q2, Scorpio Tankers reported EPS at $1.53, down from $4.34 in the same quarter last year. Despite falling year on year, this print easily cleared analysts’ estimates. Over the next 12 months, Wall Street expects Scorpio Tankers’s full-year EPS of $7.34 to shrink by 20.6%.
Key Takeaways from Scorpio Tankers’s Q2 Results
We were impressed by how significantly Scorpio Tankers blew past analysts’ EPS expectations this quarter. We were also excited its EBITDA outperformed Wall Street’s estimates by a wide margin. Zooming out, we think this was a solid print. The stock remained flat at $45.44 immediately following the results.
Sure, Scorpio Tankers had a solid quarter, but if we look at the bigger picture, is this stock a buy? We think that the latest quarter is only one piece of the longer-term business quality puzzle. Quality, when combined with valuation, can help determine if the stock is a buy. We cover that in our actionable full research report which you can read here, it’s free.