
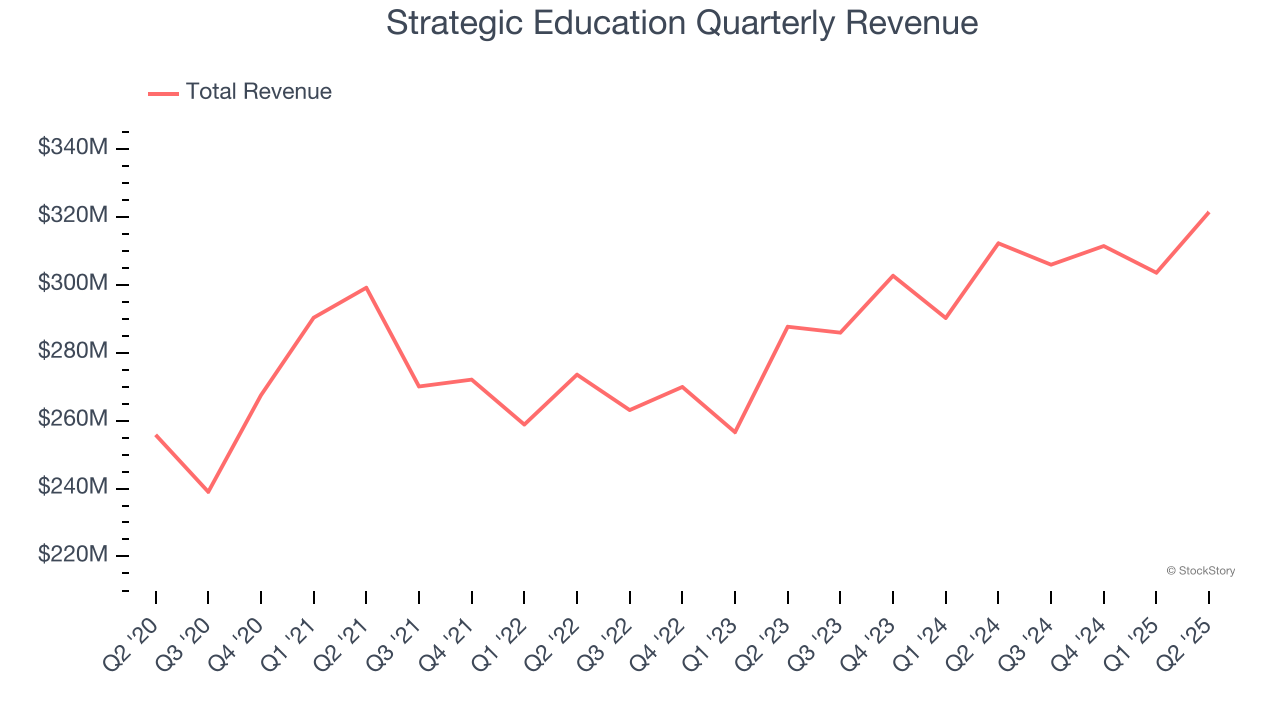
Higher education company Strategic Education (NASDAQ: STRA) missed Wall Street’s revenue expectations in Q2 CY2025 as sales rose 2.9% year on year to $321.5 million. Its non-GAAP profit of $1.52 per share was 6% above analysts’ consensus estimates.
Is now the time to buy Strategic Education? Find out by accessing our full research report, it’s free.
Strategic Education (STRA) Q2 CY2025 Highlights:
- Revenue: $321.5 million vs analyst estimates of $323.3 million (2.9% year-on-year growth, 0.6% miss)
- Adjusted EPS: $1.52 vs analyst estimates of $1.43 (6% beat)
- Adjusted EBITDA: $68.27 million vs analyst estimates of $64.48 million (21.2% margin, 5.9% beat)
- Operating Margin: 14.2%, in line with the same quarter last year
- Free Cash Flow Margin: 6.3%, up from 4.3% in the same quarter last year
- Domestic Students: 86,339, in line with the same quarter last year
- Market Capitalization: $1.9 billion
HERNDON, Va.--(BUSINESS WIRE)--Strategic Education, Inc. (Strategic Education) (NASDAQ: STRA) today announced financial results for the period ended March 31, 2025. “We are pleased with our first quarter results driven by continued strength across the Education Technology Services segment and ongoing focus on growth through employer partnerships,” said Karl McDonnell, Chief Executive Officer of Strategic Education.
Company Overview
Formed through the merger of Strayer Education and Capella Education in 2018, Strategic Education (NASDAQ: STRA) is a career-focused higher education provider.
Revenue Growth
A company’s long-term sales performance is one signal of its overall quality. Any business can have short-term success, but a top-tier one grows for years. Regrettably, Strategic Education’s sales grew at a sluggish 3.9% compounded annual growth rate over the last five years. This was below our standard for the consumer discretionary sector and is a poor baseline for our analysis.
Long-term growth is the most important, but within consumer discretionary, product cycles are short and revenue can be hit-driven due to rapidly changing trends and consumer preferences. Strategic Education’s annualized revenue growth of 7.4% over the last two years is above its five-year trend, but we were still disappointed by the results. 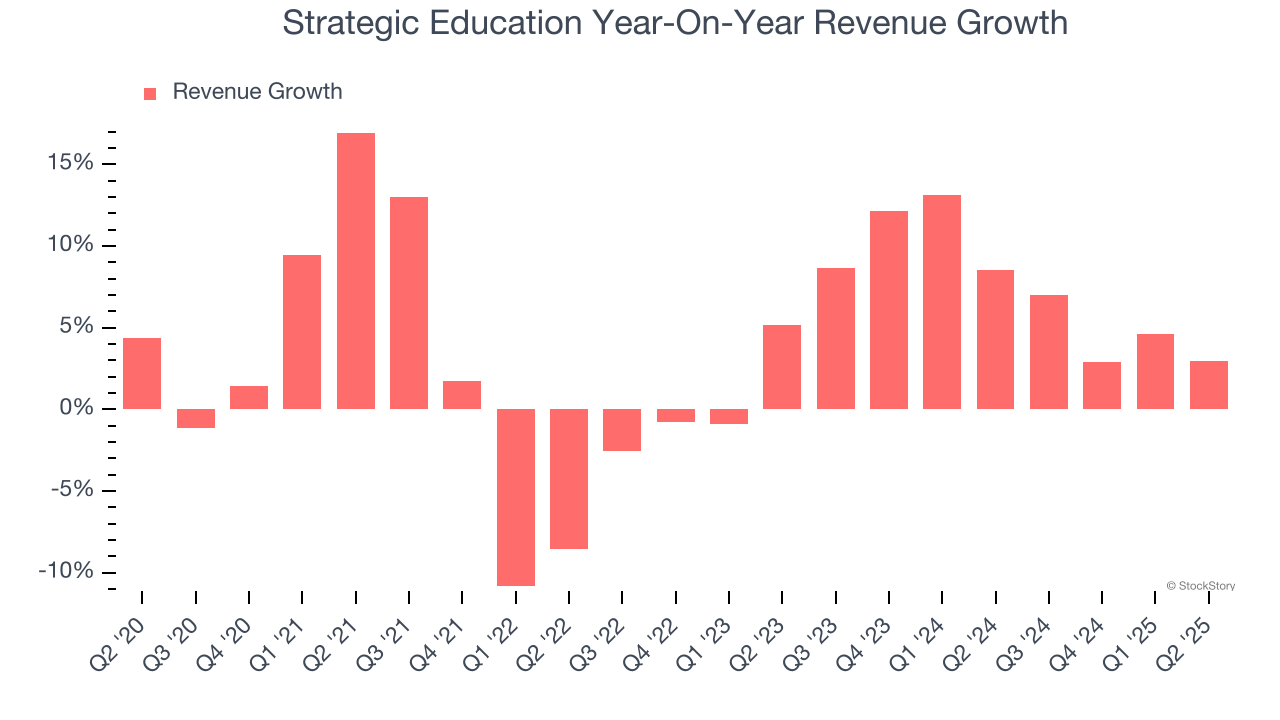
We can better understand the company’s revenue dynamics by analyzing its number of domestic students and international students, which clocked in at 86,339 and 18,524 in the latest quarter. Over the last two years, Strategic Education’s domestic students averaged 5.7% year-on-year growth while its international students averaged 1.6% year-on-year growth. 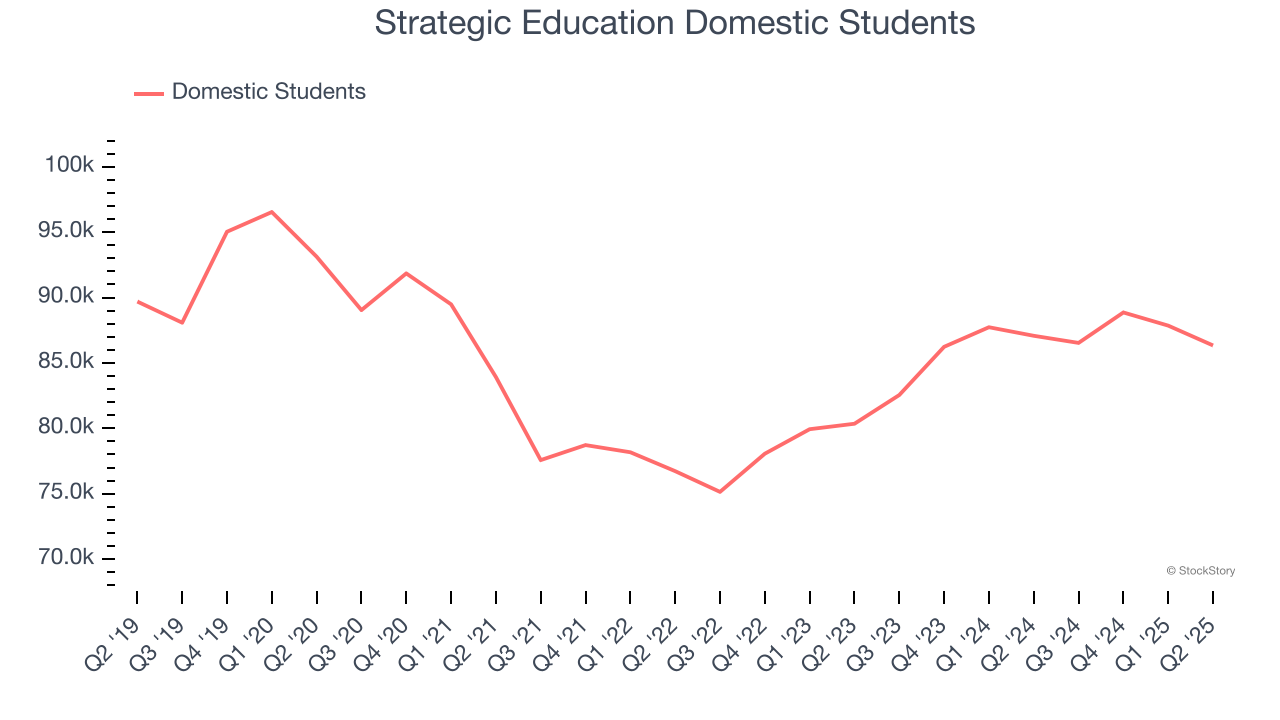
This quarter, Strategic Education’s revenue grew by 2.9% year on year to $321.5 million, falling short of Wall Street’s estimates.
Looking ahead, sell-side analysts expect revenue to grow 4.8% over the next 12 months, a slight deceleration versus the last two years. This projection is underwhelming and suggests its products and services will see some demand headwinds.
Unless you’ve been living under a rock, it should be obvious by now that generative AI is going to have a huge impact on how large corporations do business. While Nvidia and AMD are trading close to all-time highs, we prefer a lesser-known (but still profitable) stock benefiting from the rise of AI. Click here to access our free report one of our favorites growth stories.
Operating Margin
Operating margin is a key measure of profitability. Think of it as net income - the bottom line - excluding the impact of taxes and interest on debt, which are less connected to business fundamentals.
Strategic Education’s operating margin might fluctuated slightly over the last 12 months but has remained more or less the same, averaging 13.2% over the last two years. This profitability was solid for a consumer discretionary business and shows it’s an efficient company that manages its expenses well.
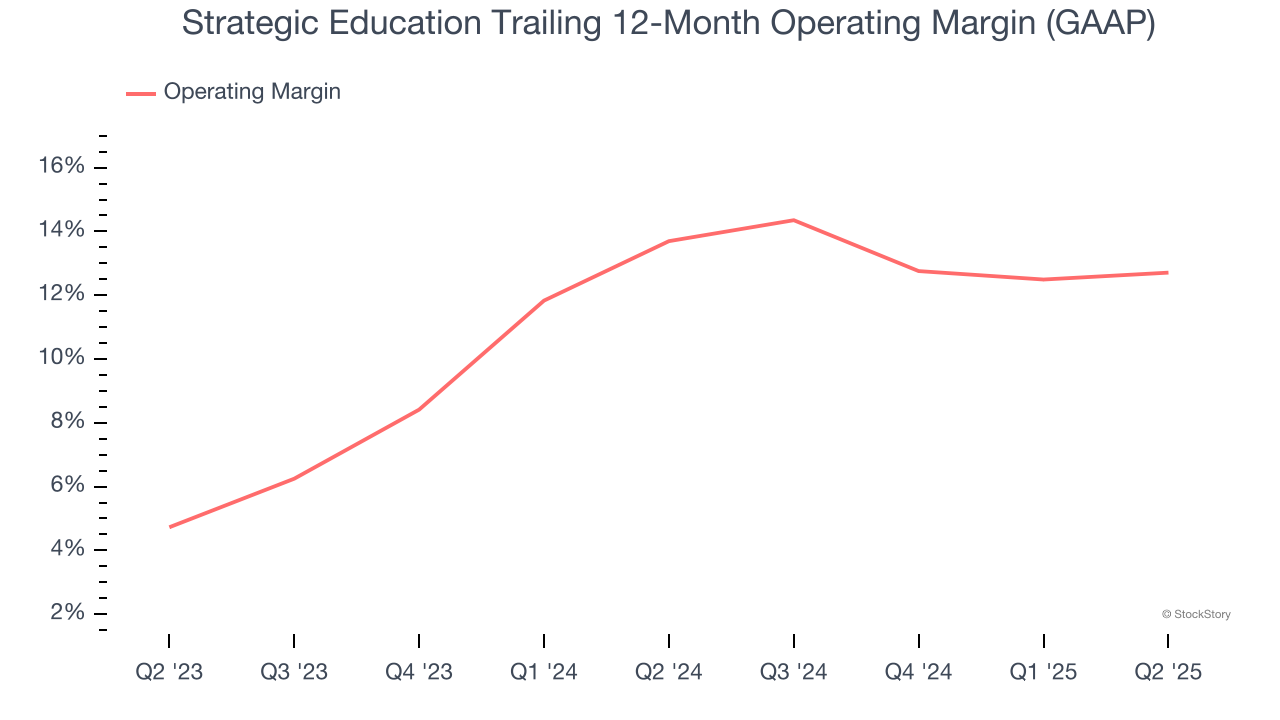
This quarter, Strategic Education generated an operating margin profit margin of 14.2%, in line with the same quarter last year. This indicates the company’s overall cost structure has been relatively stable.
Earnings Per Share
Revenue trends explain a company’s historical growth, but the long-term change in earnings per share (EPS) points to the profitability of that growth – for example, a company could inflate its sales through excessive spending on advertising and promotions.
Sadly for Strategic Education, its EPS declined by 7.1% annually over the last five years while its revenue grew by 3.9%. This tells us the company became less profitable on a per-share basis as it expanded.
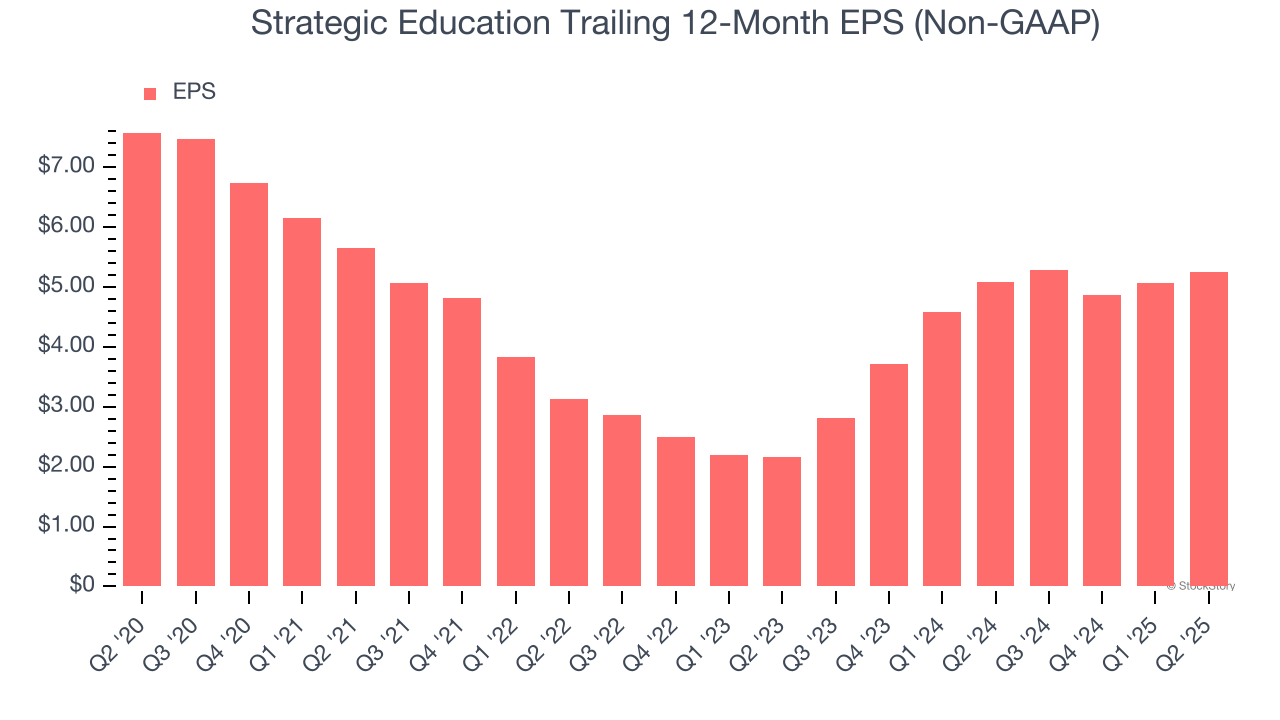
In Q2, Strategic Education reported EPS at $1.52, up from $1.33 in the same quarter last year. This print beat analysts’ estimates by 6%. Over the next 12 months, Wall Street expects Strategic Education’s full-year EPS of $5.25 to grow 15.9%.
Key Takeaways from Strategic Education’s Q2 Results
It was encouraging to see Strategic Education beat analysts’ EBITDA expectations this quarter. We were also happy its EPS outperformed Wall Street’s estimates. On the other hand, its number of domestic students missed and its revenue fell slightly short of Wall Street’s estimates. Zooming out, we think this was a mixed quarter. The stock remained flat at $79.50 immediately following the results.
Should you buy the stock or not? If you’re making that decision, you should consider the bigger picture of valuation, business qualities, as well as the latest earnings. We cover that in our actionable full research report which you can read here, it’s free.


