Cybersecurity software maker Tenable (NASDAQ: TENB) reported Q2 CY2025 results topping the market’s revenue expectations, with sales up 11.8% year on year to $247.3 million. Guidance for next quarter’s revenue was better than expected at $247 million at the midpoint, 1.3% above analysts’ estimates. Its non-GAAP profit of $0.34 per share was 12.3% above analysts’ consensus estimates.
Is now the time to buy Tenable? Find out by accessing our full research report, it’s free.
Tenable (TENB) Q2 CY2025 Highlights:
- Revenue: $247.3 million vs analyst estimates of $242.1 million (11.8% year-on-year growth, 2.2% beat)
- Adjusted EPS: $0.34 vs analyst estimates of $0.30 (12.3% beat)
- Adjusted Operating Income: $47.7 million vs analyst estimates of $44.19 million (19.3% margin, 7.9% beat)
- The company slightly lifted its revenue guidance for the full year to $984 million at the midpoint from $975 million
- Adjusted EPS guidance for the full year is $1.49 at the midpoint, roughly in line with what analysts were expecting
- Operating Margin: -3%, in line with the same quarter last year
- Free Cash Flow Margin: 15.1%, down from 33.5% in the previous quarter
- Billings: $238.6 million at quarter end, up 6.4% year on year
- Market Capitalization: $4.02 billion
"We beat all of our guided metrics during the quarter, delivering 12% revenue growth and 19% operating margin," said Steve Vintz, Co-CEO of Tenable.
Company Overview
Founded in 2002 by three cybersecurity veterans, Tenable (NASDAQ: TENB) provides software as a service that helps companies understand where they are exposed to cyber security risk and how to reduce it.
Revenue Growth
Reviewing a company’s long-term sales performance reveals insights into its quality. Any business can have short-term success, but a top-tier one grows for years. Over the last three years, Tenable grew its sales at a 15.8% compounded annual growth rate. Although this growth is acceptable on an absolute basis, it fell slightly short of our standards for the software sector, which enjoys a number of secular tailwinds.
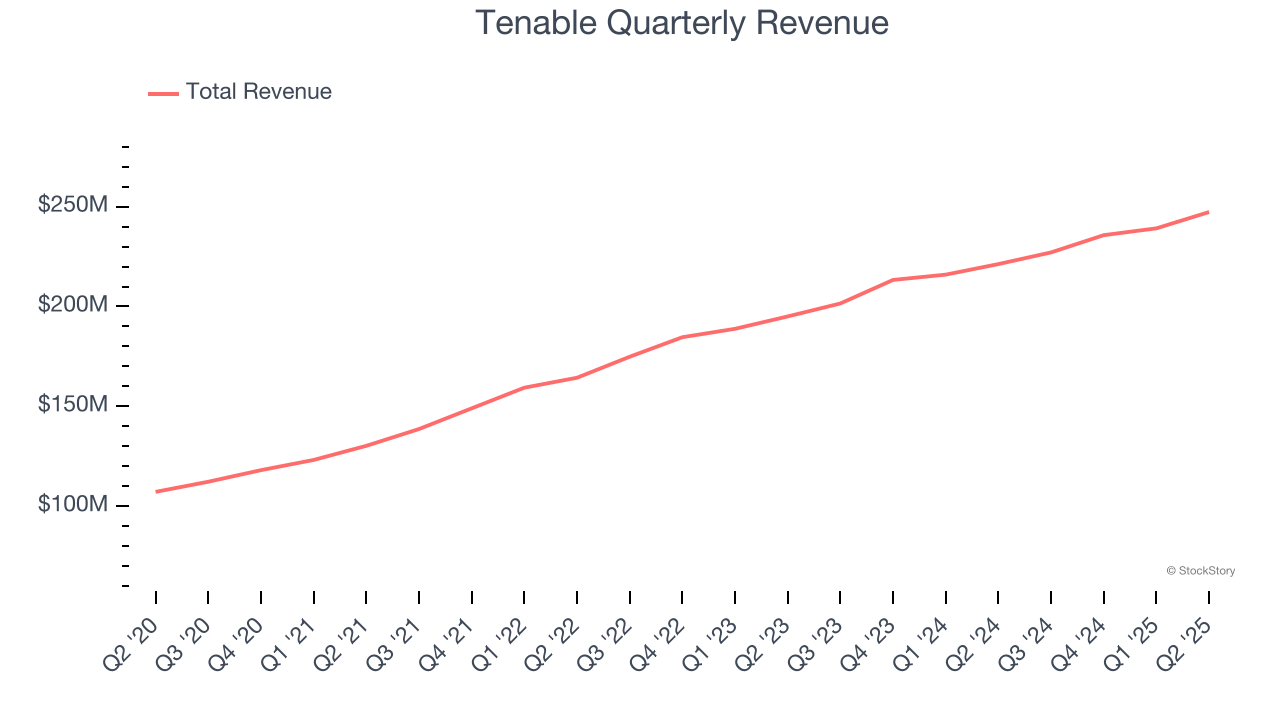
This quarter, Tenable reported year-on-year revenue growth of 11.8%, and its $247.3 million of revenue exceeded Wall Street’s estimates by 2.2%. Company management is currently guiding for a 8.8% year-on-year increase in sales next quarter.
Looking further ahead, sell-side analysts expect revenue to grow 6.4% over the next 12 months, a deceleration versus the last three years. This projection doesn't excite us and indicates its products and services will see some demand headwinds.
Today’s young investors won’t have read the timeless lessons in Gorilla Game: Picking Winners In High Technology because it was written more than 20 years ago when Microsoft and Apple were first establishing their supremacy. But if we apply the same principles, then enterprise software stocks leveraging their own generative AI capabilities may well be the Gorillas of the future. So, in that spirit, we are excited to present our Special Free Report on a profitable, fast-growing enterprise software stock that is already riding the automation wave and looking to catch the generative AI next.
Billings
Billings is a non-GAAP metric that is often called “cash revenue” because it shows how much money the company has collected from customers in a certain period. This is different from revenue, which must be recognized in pieces over the length of a contract.
Tenable’s billings punched in at $238.6 million in Q2, and over the last four quarters, its growth slightly outpaced the sector as it averaged 10.7% year-on-year increases. This performance aligned with its total sales growth and shows the company is successfully converting sales into cash. Its growth also enhances liquidity and provides a solid foundation for future investments. 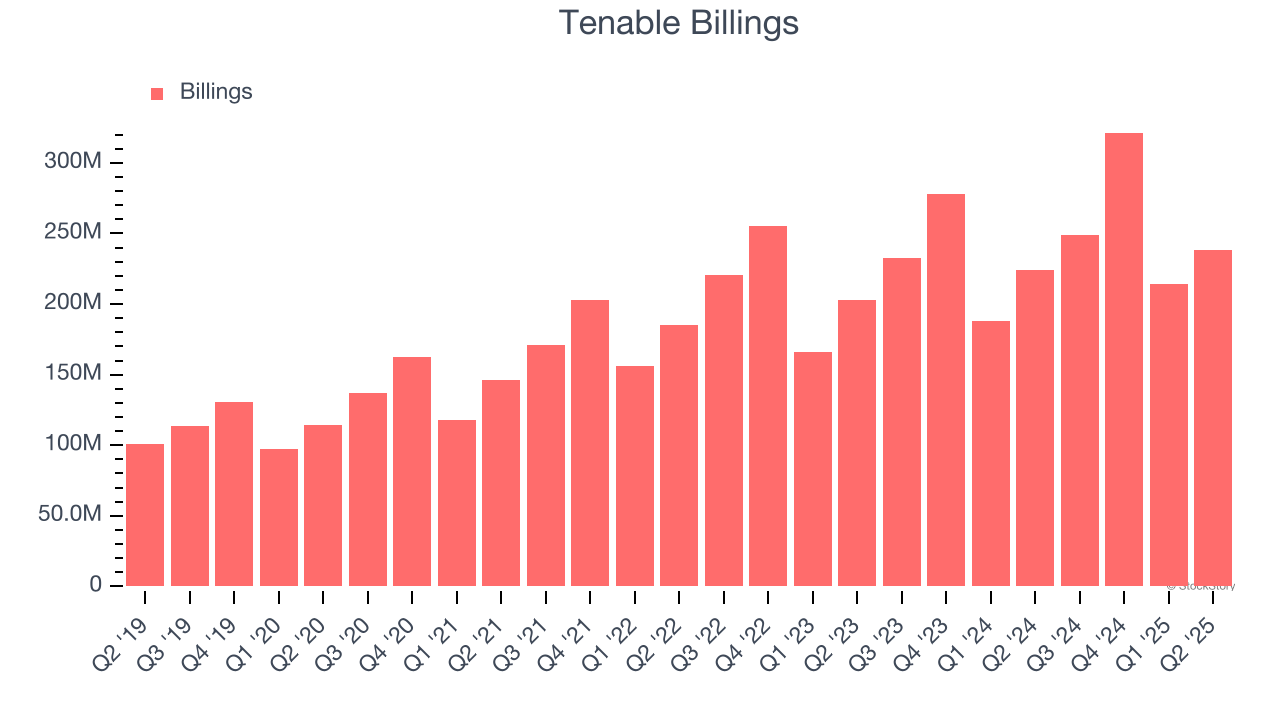
Customer Acquisition Efficiency
The customer acquisition cost (CAC) payback period represents the months required to recover the cost of acquiring a new customer. Essentially, it’s the break-even point for sales and marketing investments. A shorter CAC payback period is ideal, as it implies better returns on investment and business scalability.
It’s relatively expensive for Tenable to acquire new customers as its CAC payback period checked in at 66.6 months this quarter. The company’s slow recovery of its sales and marketing expenses indicates it operates in a highly competitive market and must invest to stand out, even if the return on that investment is low. 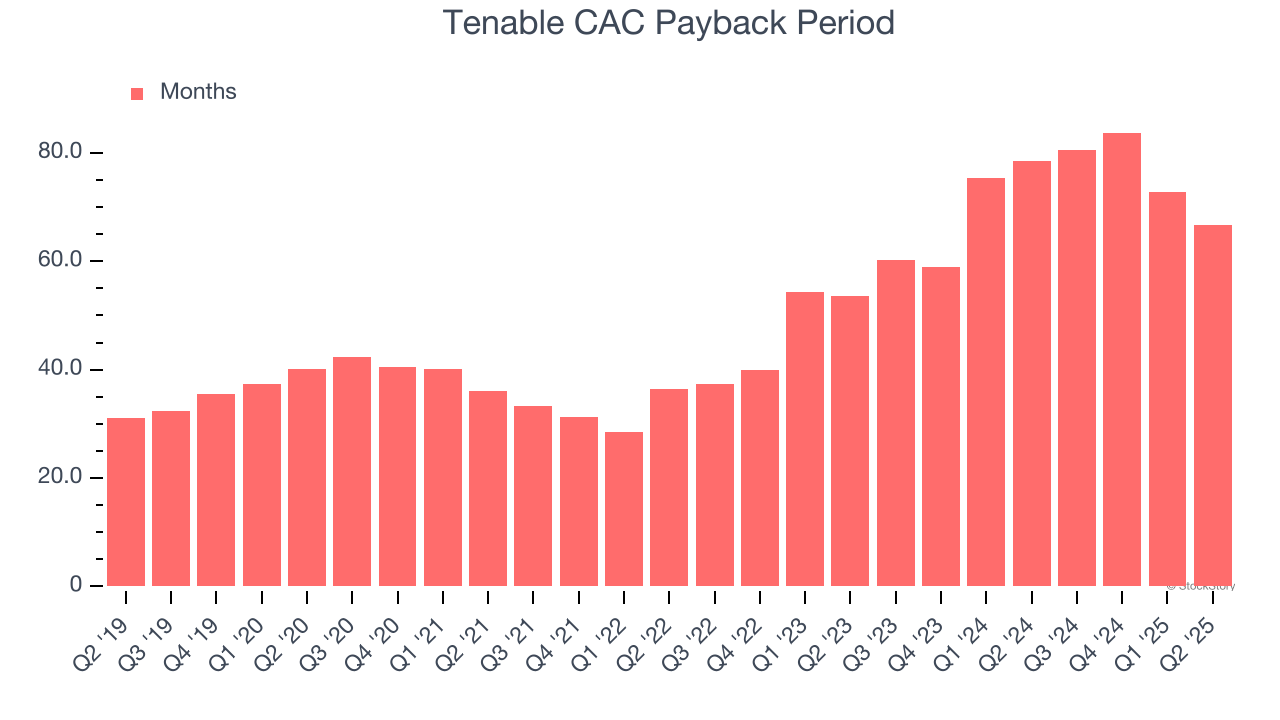
Key Takeaways from Tenable’s Q2 Results
It was good to see Tenable provide revenue guidance for next quarter that slightly beat analysts’ expectations. We were also happy its revenue outperformed Wall Street’s estimates. On the other hand, its billings fell slightly short of Wall Street’s estimates. Still, this was a good quarter. The stock traded up 11.8% to $36.05 immediately following the results.
Big picture, is Tenable a buy here and now? We think that the latest quarter is only one piece of the longer-term business quality puzzle. Quality, when combined with valuation, can help determine if the stock is a buy. We cover that in our actionable full research report which you can read here, it’s free.