Electricity generation and hydrogen production company Bloom Energy (NYSE: BE) reported Q2 CY2025 results beating Wall Street’s revenue expectations, with sales up 19.5% year on year to $401.2 million. The company expects the full year’s revenue to be around $1.75 billion, close to analysts’ estimates. Its non-GAAP profit of $0.10 per share was significantly above analysts’ consensus estimates.
Is now the time to buy Bloom Energy? Find out by accessing our full research report, it’s free.
Bloom Energy (BE) Q2 CY2025 Highlights:
- Revenue: $401.2 million vs analyst estimates of $376.6 million (19.5% year-on-year growth, 6.5% beat)
- Adjusted EPS: $0.10 vs analyst estimates of $0.02 (significant beat)
- Adjusted EBITDA: $41.24 million vs analyst estimates of $27.86 million (10.3% margin, 48% beat)
- The company reconfirmed its revenue guidance for the full year of $1.75 billion at the midpoint
- Operating Margin: -0.9%, up from -6.9% in the same quarter last year
- Free Cash Flow was -$220.4 million compared to -$187.5 million in the same quarter last year
- Market Capitalization: $8.68 billion
Company Overview
Working in stealth mode for eight years, Bloom Energy (NYSE: BE) designs, manufactures, and markets solid oxide fuel cell systems for on-site power generation.
Revenue Growth
A company’s long-term performance is an indicator of its overall quality. Even a bad business can shine for one or two quarters, but a top-tier one grows for years. Thankfully, Bloom Energy’s 15.8% annualized revenue growth over the last five years was incredible. Its growth surpassed the average industrials company and shows its offerings resonate with customers, a great starting point for our analysis.
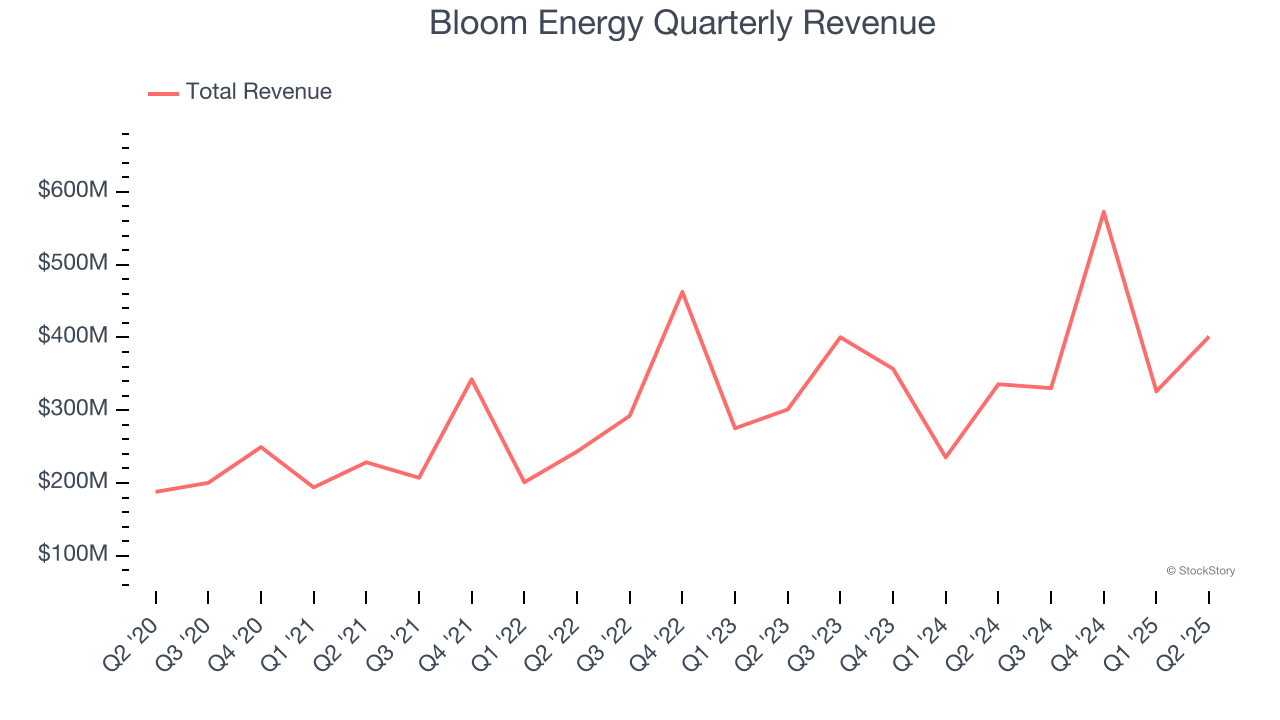
We at StockStory place the most emphasis on long-term growth, but within industrials, a half-decade historical view may miss cycles, industry trends, or a company capitalizing on catalysts such as a new contract win or a successful product line. Bloom Energy’s annualized revenue growth of 10.7% over the last two years is below its five-year trend, but we still think the results suggest healthy demand. Bloom Energy’s recent performance shows it’s one of the better Renewable Energy businesses as many of its peers faced declining sales because of cyclical headwinds. 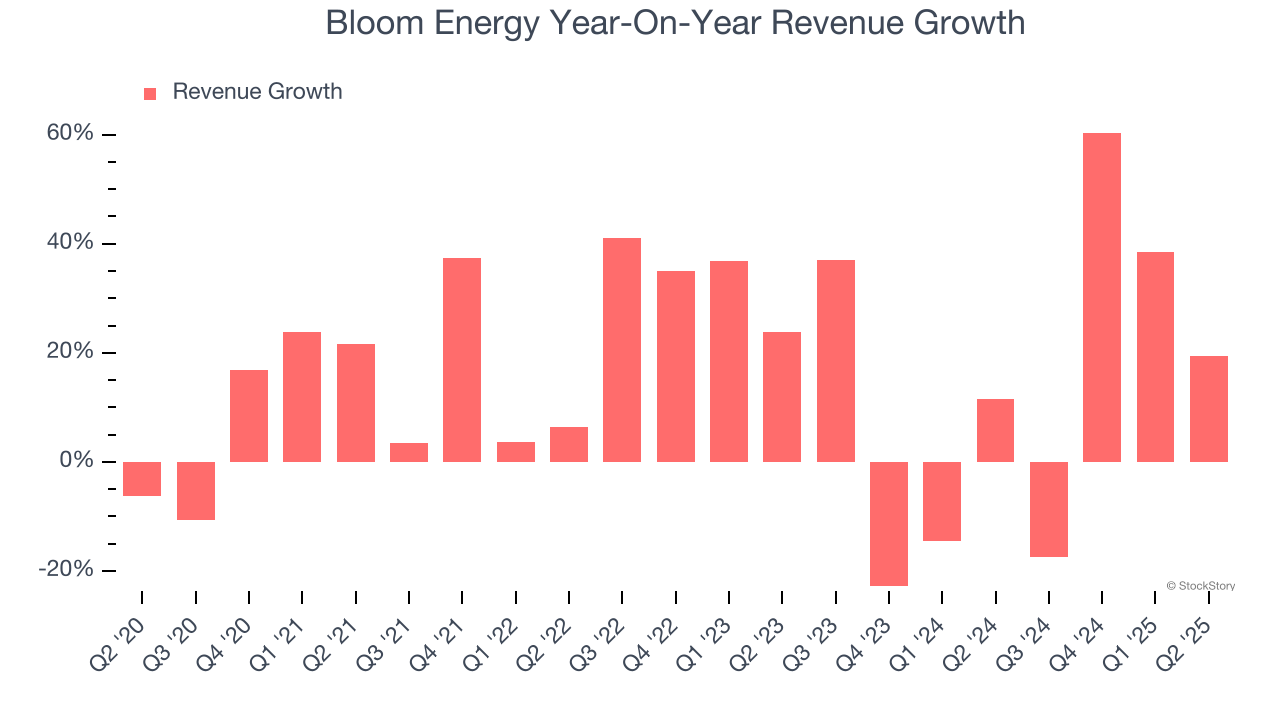
We can better understand the company’s revenue dynamics by analyzing its most important segments, Product and Service, which are 73.9% and 13.6% of revenue. Over the last two years, Bloom Energy’s Product revenue (energy servers and electrolyzers) averaged 15.8% year-on-year growth while its Service revenue (operations and maintenance agreements) averaged 16.2% growth. 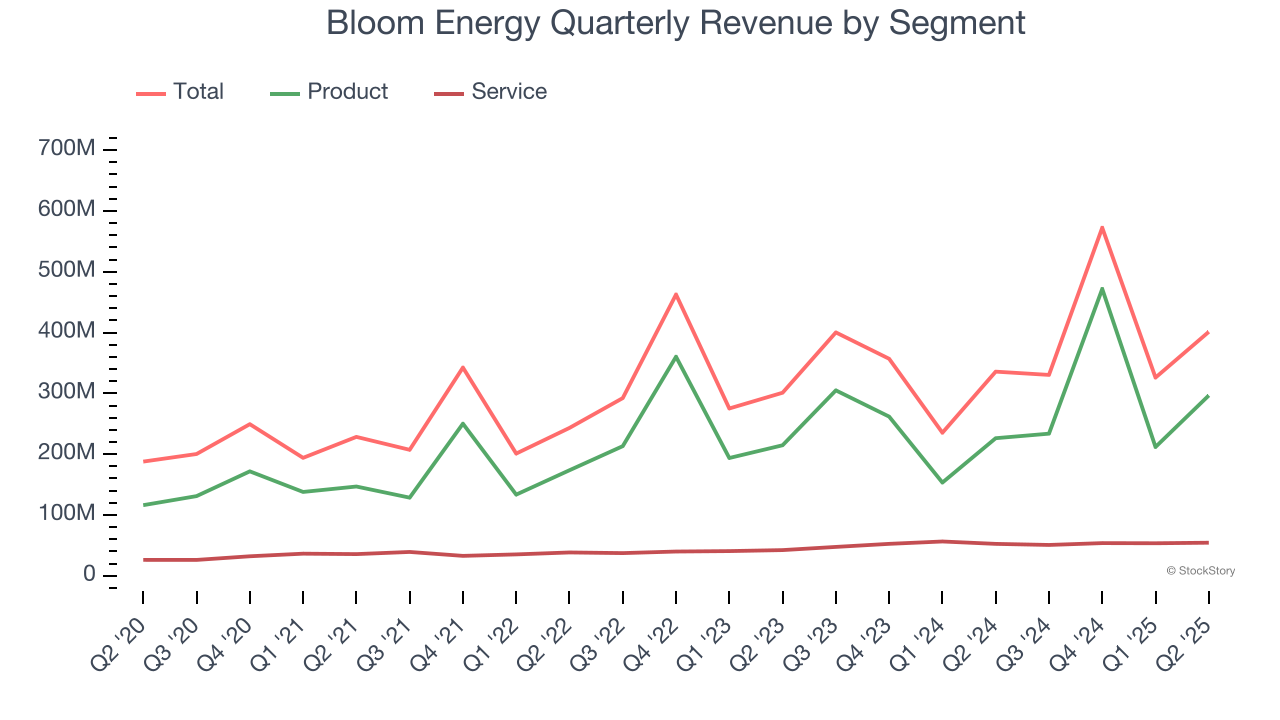
This quarter, Bloom Energy reported year-on-year revenue growth of 19.5%, and its $401.2 million of revenue exceeded Wall Street’s estimates by 6.5%.
Looking ahead, sell-side analysts expect revenue to grow 14.8% over the next 12 months, an improvement versus the last two years. This projection is healthy and implies its newer products and services will spur better top-line performance.
Today’s young investors won’t have read the timeless lessons in Gorilla Game: Picking Winners In High Technology because it was written more than 20 years ago when Microsoft and Apple were first establishing their supremacy. But if we apply the same principles, then enterprise software stocks leveraging their own generative AI capabilities may well be the Gorillas of the future. So, in that spirit, we are excited to present our Special Free Report on a profitable, fast-growing enterprise software stock that is already riding the automation wave and looking to catch the generative AI next.
Operating Margin
Although Bloom Energy broke even this quarter from an operational perspective, it’s generally struggled over a longer time period. Its expensive cost structure has contributed to an average operating margin of negative 9.6% over the last five years. Unprofitable industrials companies require extra attention because they could get caught swimming naked when the tide goes out.
On the plus side, Bloom Energy’s operating margin rose by 11.6 percentage points over the last five years, as its sales growth gave it operating leverage. Still, it will take much more for the company to reach long-term profitability.
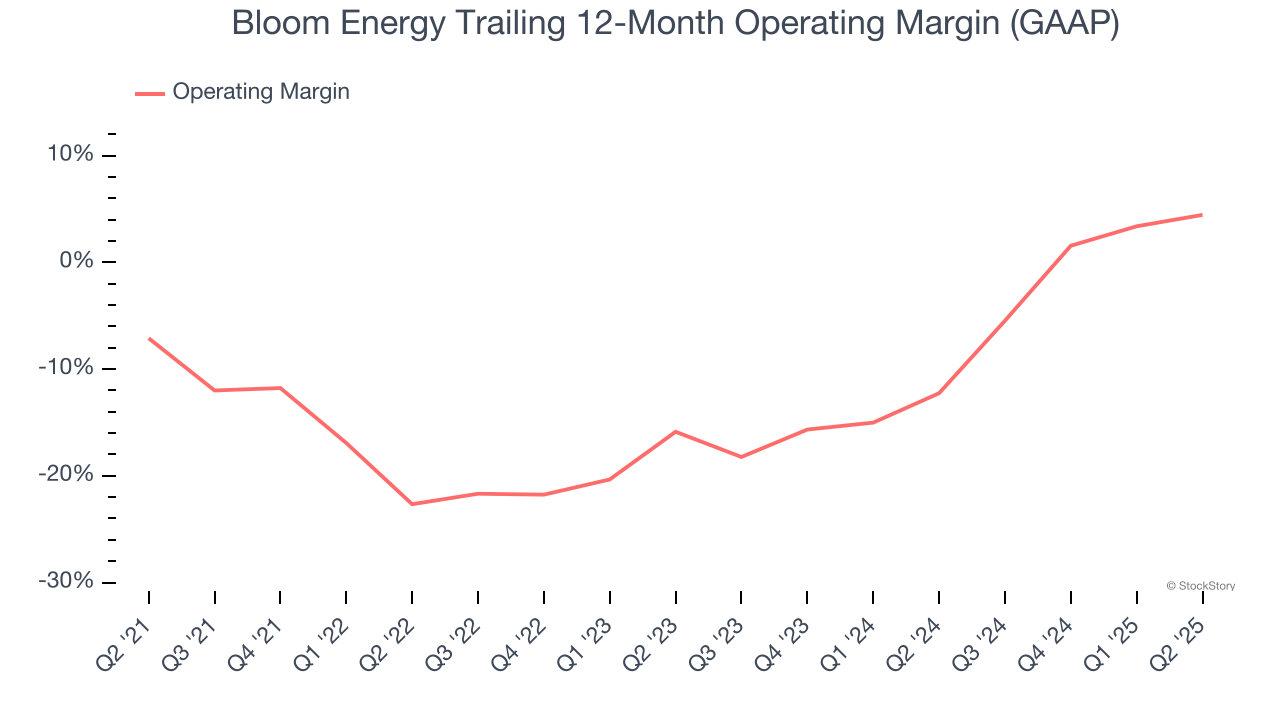
Bloom Energy’s operating margin was negative 0.9% this quarter.
Earnings Per Share
Revenue trends explain a company’s historical growth, but the long-term change in earnings per share (EPS) points to the profitability of that growth – for example, a company could inflate its sales through excessive spending on advertising and promotions.
Bloom Energy’s full-year EPS flipped from negative to positive over the last five years. This is a good sign and shows it’s at an inflection point.
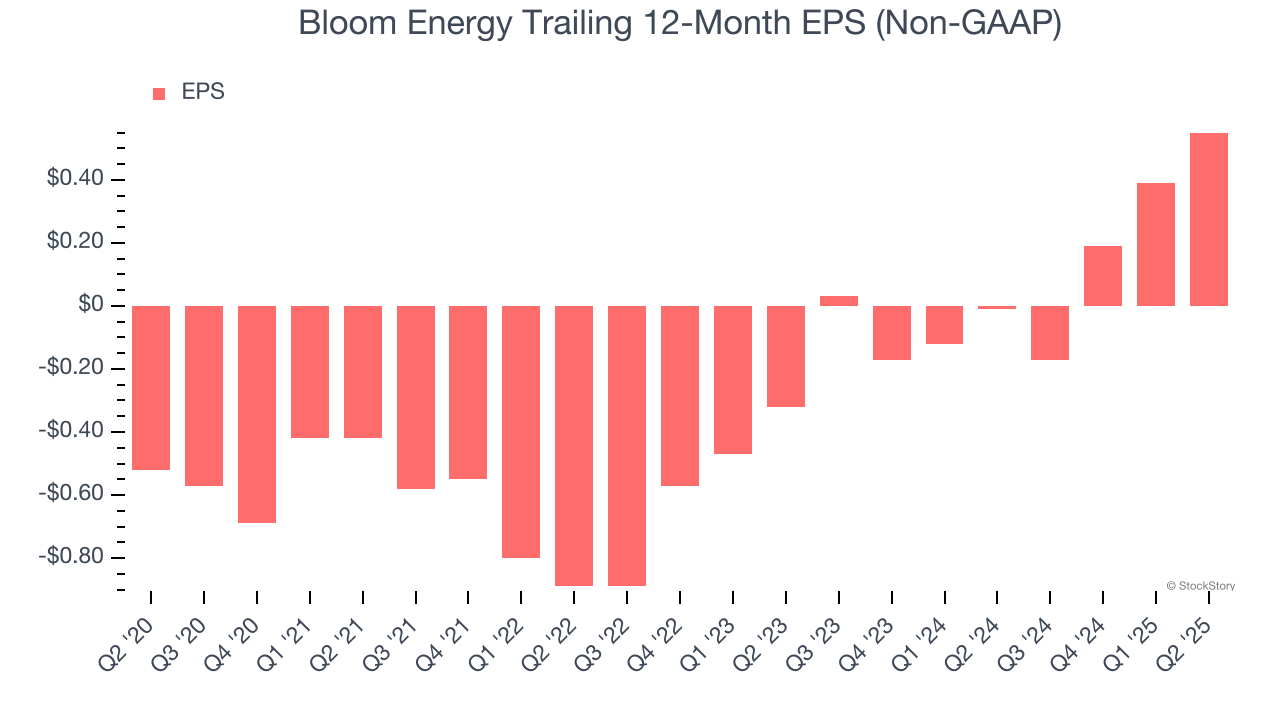
Like with revenue, we analyze EPS over a more recent period because it can provide insight into an emerging theme or development for the business.
For Bloom Energy, its two-year annual EPS growth of 92.8% was higher than its five-year trend. We love it when earnings growth accelerates, especially when it accelerates off an already high base.
In Q2, Bloom Energy reported adjusted EPS at $0.10, up from negative $0.06 in the same quarter last year. This print easily cleared analysts’ estimates, and shareholders should be content with the results. Over the next 12 months, Wall Street expects Bloom Energy’s full-year EPS of $0.55 to grow 8.6%.
Key Takeaways from Bloom Energy’s Q2 Results
We were impressed by how significantly Bloom Energy blew past analysts’ EPS and EBITDA expectations this quarter. We were also excited its revenue outperformed Wall Street’s estimates. Zooming out, we think this was a solid print. Investors were likely hoping for more given the sky-high valuation, and shares traded down 7.3% to $34.65 immediately following the results.
Is Bloom Energy an attractive investment opportunity right now? When making that decision, it’s important to consider its valuation, business qualities, as well as what has happened in the latest quarter. We cover that in our actionable full research report which you can read here, it’s free.