Child care and education company Bright Horizons (NYSE: BFAM) reported Q2 CY2025 results topping the market’s revenue expectations, with sales up 9.2% year on year to $731.6 million. The company’s full-year revenue guidance of $2.91 billion at the midpoint came in 0.8% above analysts’ estimates. Its non-GAAP profit of $1.07 per share was 5.8% above analysts’ consensus estimates.
Is now the time to buy Bright Horizons? Find out by accessing our full research report, it’s free.
Bright Horizons (BFAM) Q2 CY2025 Highlights:
- Revenue: $731.6 million vs analyst estimates of $723.8 million (9.2% year-on-year growth, 1.1% beat)
- Adjusted EPS: $1.07 vs analyst estimates of $1.01 (5.8% beat)
- Adjusted EBITDA: $115.6 million vs analyst estimates of $112.7 million (15.8% margin, 2.6% beat)
- The company slightly lifted its revenue guidance for the full year to $2.91 billion at the midpoint from $2.89 billion
- Management raised its full-year Adjusted EPS guidance to $4.20 at the midpoint, a 3.7% increase
- Operating Margin: 11.8%, up from 10.3% in the same quarter last year
- Free Cash Flow Margin: 15.8%, up from 13% in the same quarter last year
- Market Capitalization: $6.48 billion
Company Overview
Founded in 1986, Bright Horizons (NYSE: BFAM) is a global provider of child care, early education, and workforce support solutions.
Revenue Growth
A company’s long-term sales performance can indicate its overall quality. Any business can put up a good quarter or two, but the best consistently grow over the long haul. Regrettably, Bright Horizons’s sales grew at a sluggish 8.8% compounded annual growth rate over the last five years. This fell short of our benchmark for the consumer discretionary sector and is a poor baseline for our analysis.
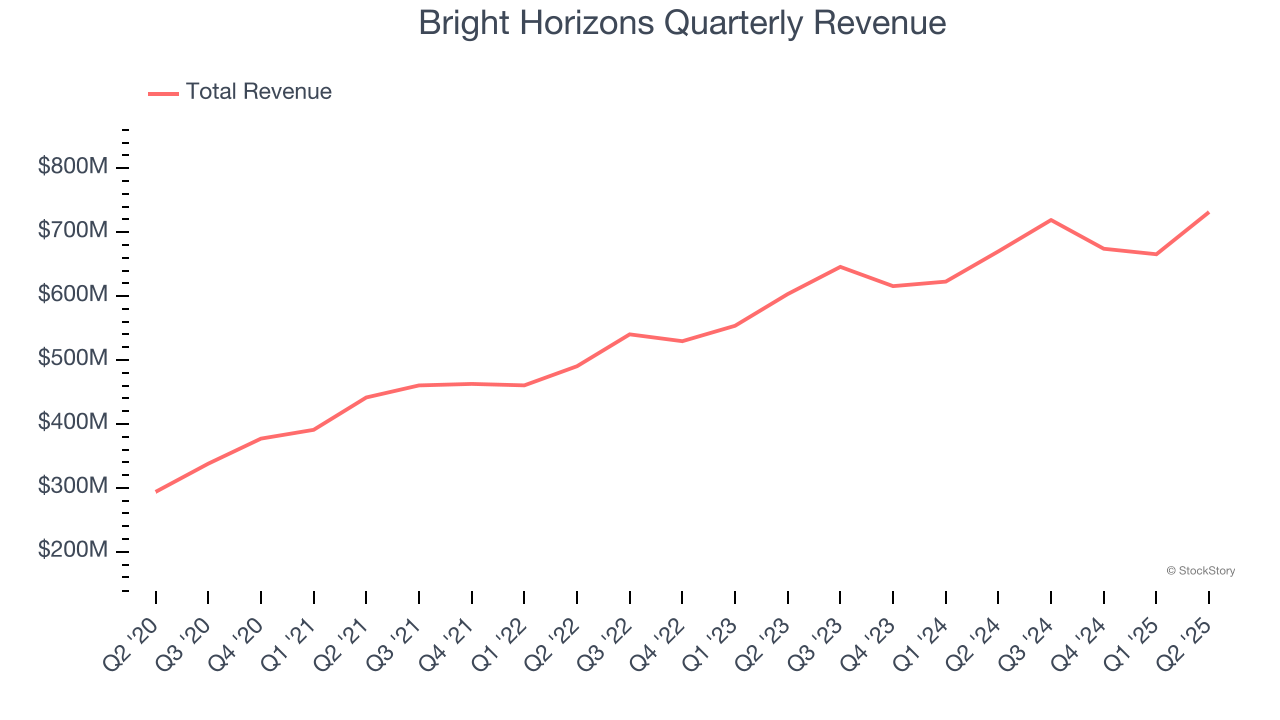
Long-term growth is the most important, but within consumer discretionary, product cycles are short and revenue can be hit-driven due to rapidly changing trends and consumer preferences. Bright Horizons’s annualized revenue growth of 11.9% over the last two years is above its five-year trend, but we were still disappointed by the results. 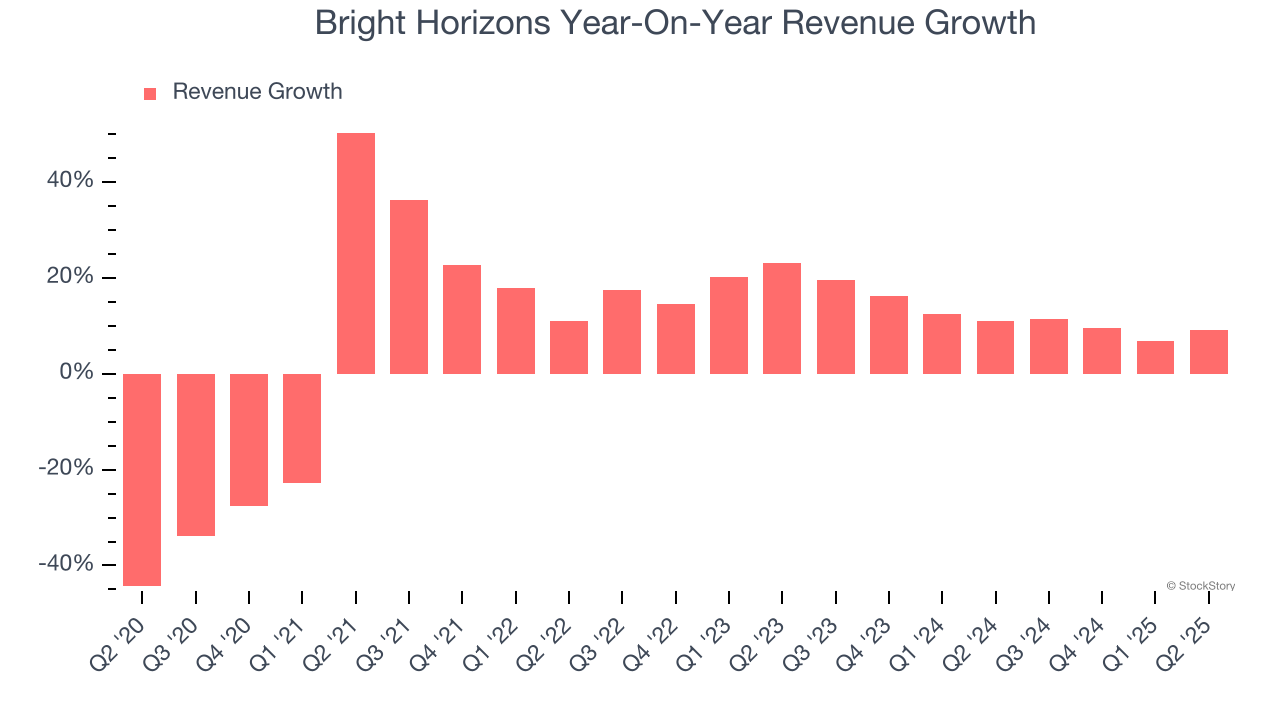
This quarter, Bright Horizons reported year-on-year revenue growth of 9.2%, and its $731.6 million of revenue exceeded Wall Street’s estimates by 1.1%.
Looking ahead, sell-side analysts expect revenue to grow 6.8% over the next 12 months, a deceleration versus the last two years. This projection is underwhelming and suggests its products and services will see some demand headwinds.
Software is eating the world and there is virtually no industry left that has been untouched by it. That drives increasing demand for tools helping software developers do their jobs, whether it be monitoring critical cloud infrastructure, integrating audio and video functionality, or ensuring smooth content streaming. Click here to access a free report on our 3 favorite stocks to play this generational megatrend.
Operating Margin
Operating margin is an important measure of profitability as it shows the portion of revenue left after accounting for all core expenses – everything from the cost of goods sold to advertising and wages. It’s also useful for comparing profitability across companies with different levels of debt and tax rates because it excludes interest and taxes.
Bright Horizons’s operating margin has been trending up over the last 12 months and averaged 9.2% over the last two years. The company’s higher efficiency is a breath of fresh air, but its suboptimal cost structure means it still sports mediocre profitability for a consumer discretionary business.
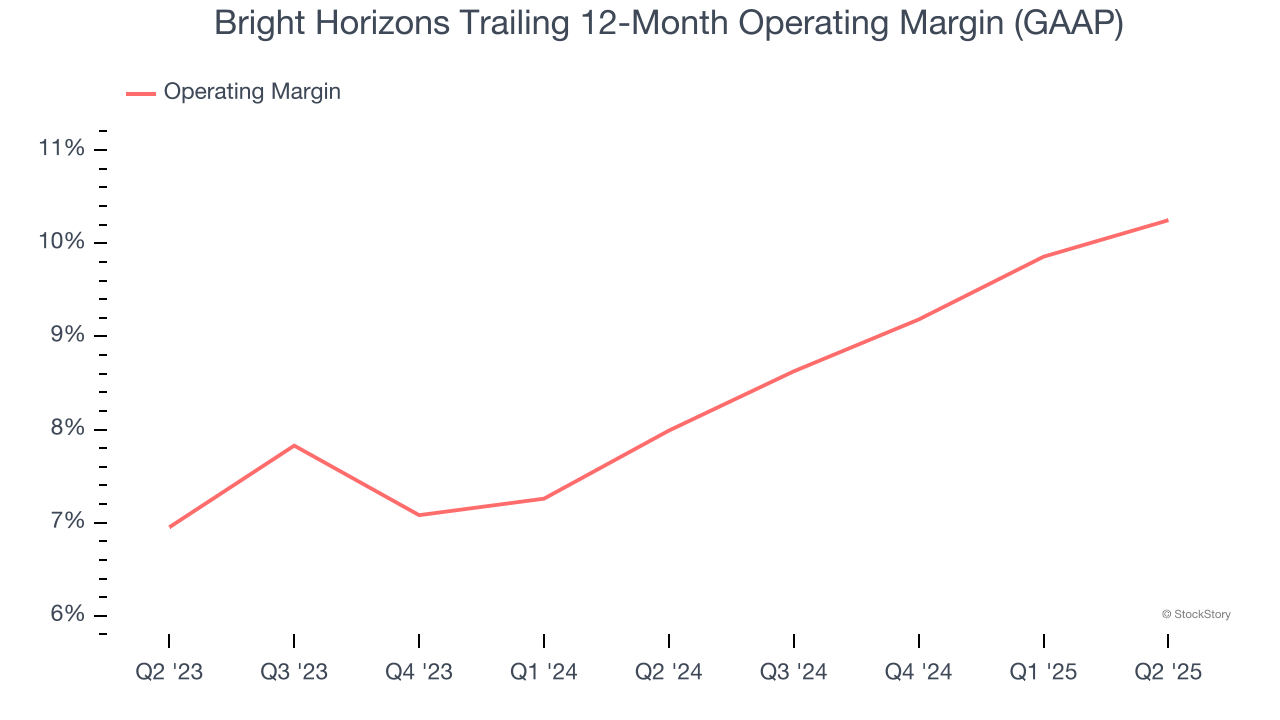
This quarter, Bright Horizons generated an operating margin profit margin of 11.8%, up 1.5 percentage points year on year. This increase was a welcome development and shows it was more efficient.
Earnings Per Share
Revenue trends explain a company’s historical growth, but the long-term change in earnings per share (EPS) points to the profitability of that growth – for example, a company could inflate its sales through excessive spending on advertising and promotions.
Bright Horizons’s EPS grew at an unimpressive 5.2% compounded annual growth rate over the last five years, lower than its 8.8% annualized revenue growth. We can see the difference stemmed from higher interest expenses or taxes as the company actually improved its operating margin and repurchased its shares during this time.
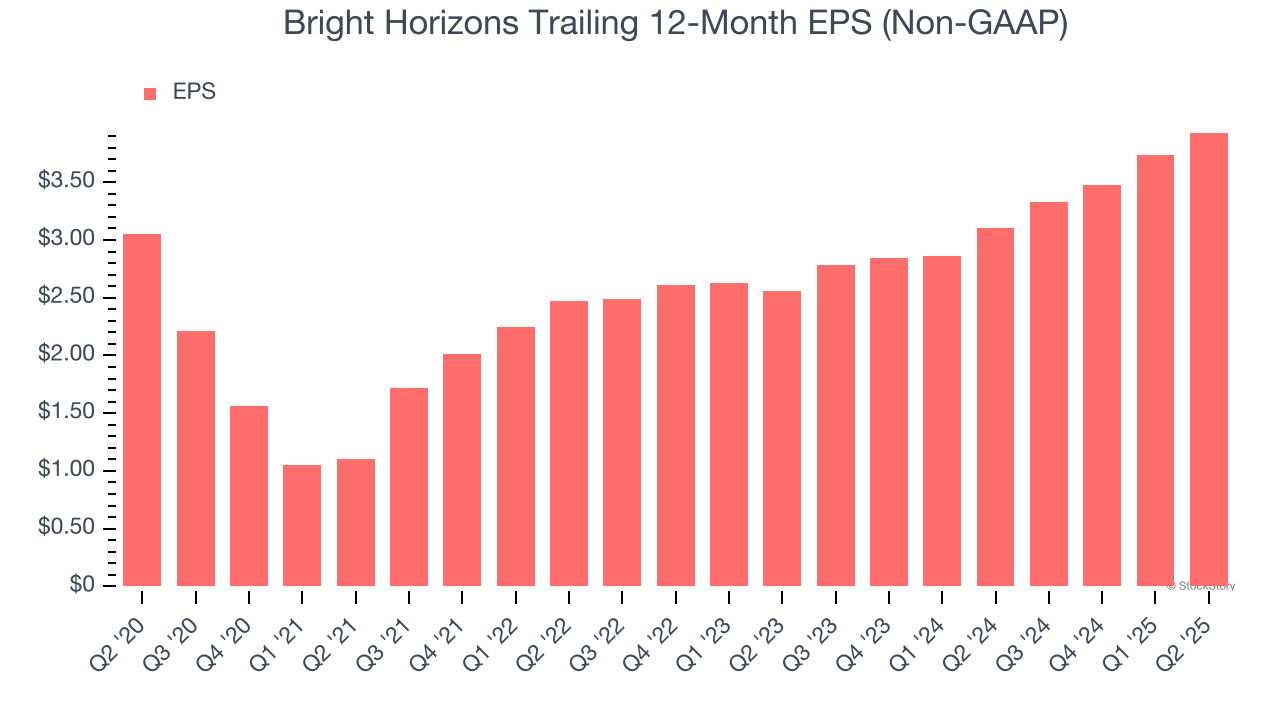
In Q2, Bright Horizons reported adjusted EPS at $1.07, up from $0.88 in the same quarter last year. This print beat analysts’ estimates by 5.8%. Over the next 12 months, Wall Street expects Bright Horizons’s full-year EPS of $3.93 to grow 10.6%.
Key Takeaways from Bright Horizons’s Q2 Results
It was good to see Bright Horizons raise its full-year revenue and EPS guidance. We were also glad this quarter's revenue, EPS, and EBITDA exceeded Wall Street’s estimates. Overall, this print had some key positives. The stock remained flat at $113.10 immediately after reporting.
So should you invest in Bright Horizons right now? The latest quarter does matter, but not nearly as much as longer-term fundamentals and valuation, when deciding if the stock is a buy. We cover that in our actionable full research report which you can read here, it’s free.