
Digital transformation consultancy Grid Dynamics (NASDAQ: GDYN) reported Q2 CY2025 results beating Wall Street’s revenue expectations, with sales up 21.7% year on year to $101.1 million. Revenue guidance for the full year exceeded analysts’ estimates, but next quarter’s guidance of $104 million was less impressive, coming in 1.2% below expectations. Its non-GAAP profit of $0.10 per share was in line with analysts’ consensus estimates.
Is now the time to buy Grid Dynamics? Find out by accessing our full research report, it’s free.
Grid Dynamics (GDYN) Q2 CY2025 Highlights:
- Revenue: $101.1 million vs analyst estimates of $100.6 million (21.7% year-on-year growth, 0.5% beat)
- Adjusted EPS: $0.10 vs analyst estimates of $0.10 (in line)
- Adjusted EBITDA: $12.75 million vs analyst estimates of $13.2 million (12.6% margin, 3.5% miss)
- The company reconfirmed its revenue guidance for the full year of $425 million at the midpoint
- EBITDA guidance for Q3 CY2025 is $12.5 million at the midpoint, below analyst estimates of $16.02 million
- Operating Margin: -0.1%, in line with the same quarter last year
- Market Capitalization: $820.1 million
Company Overview
With engineering centers across the Americas, Europe, and India serving Fortune 1000 companies, Grid Dynamics (NASDAQ: GDYN) provides technology consulting, engineering, and analytics services to help large enterprises modernize their technology systems and business processes.
Revenue Growth
A company’s long-term sales performance can indicate its overall quality. Any business can experience short-term success, but top-performing ones enjoy sustained growth for years.
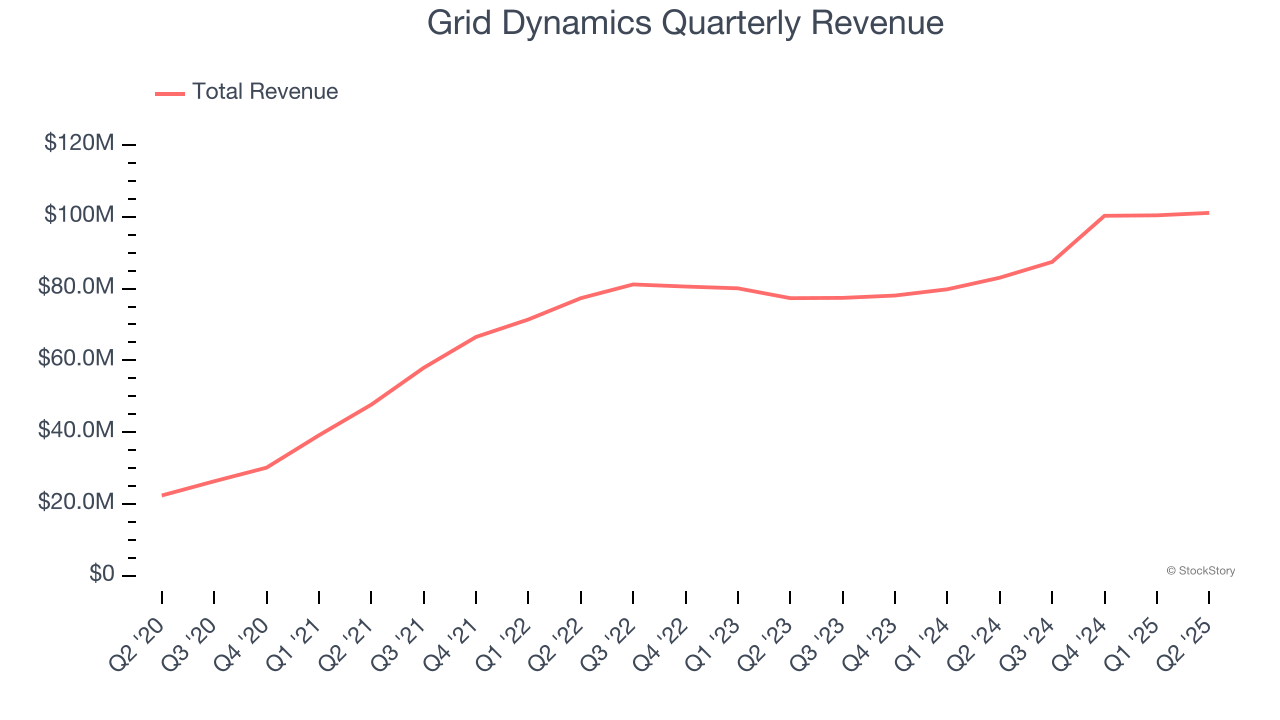
With $389.2 million in revenue over the past 12 months, Grid Dynamics is a small player in the business services space, which sometimes brings disadvantages compared to larger competitors benefiting from economies of scale and numerous distribution channels. On the bright side, it can grow faster because it has more room to expand.
As you can see below, Grid Dynamics grew its sales at an incredible 26.9% compounded annual growth rate over the last five years. This shows it had high demand, a useful starting point for our analysis.
We at StockStory place the most emphasis on long-term growth, but within business services, a half-decade historical view may miss recent innovations or disruptive industry trends. Grid Dynamics’s annualized revenue growth of 10.4% over the last two years is below its five-year trend, but we still think the results suggest healthy demand. 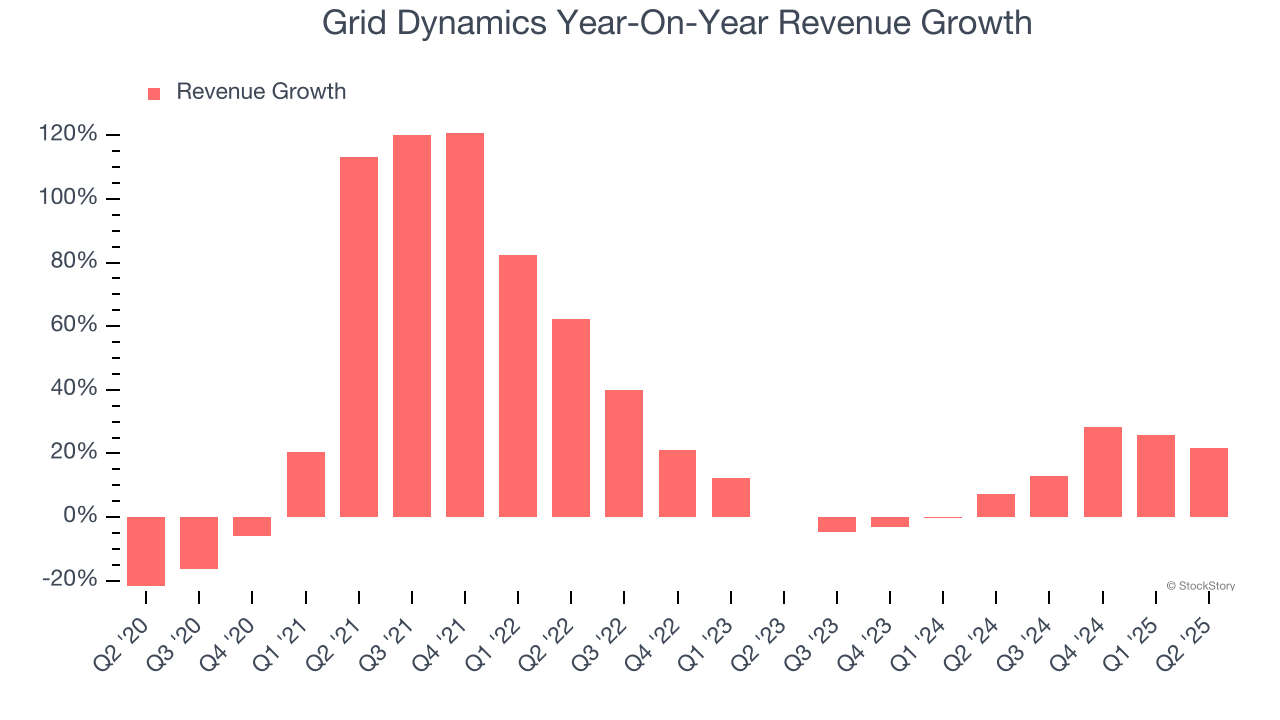
This quarter, Grid Dynamics reported robust year-on-year revenue growth of 21.7%, and its $101.1 million of revenue topped Wall Street estimates by 0.5%. Company management is currently guiding for a 18.9% year-on-year increase in sales next quarter.
Looking further ahead, sell-side analysts expect revenue to grow 13% over the next 12 months, an improvement versus the last two years. This projection is admirable and suggests its newer products and services will catalyze better top-line performance.
Today’s young investors won’t have read the timeless lessons in Gorilla Game: Picking Winners In High Technology because it was written more than 20 years ago when Microsoft and Apple were first establishing their supremacy. But if we apply the same principles, then enterprise software stocks leveraging their own generative AI capabilities may well be the Gorillas of the future. So, in that spirit, we are excited to present our Special Free Report on a profitable, fast-growing enterprise software stock that is already riding the automation wave and looking to catch the generative AI next.
Operating Margin
Operating margin is one of the best measures of profitability because it tells us how much money a company takes home after subtracting all core expenses, like marketing and R&D.
Although Grid Dynamics broke even this quarter from an operational perspective, it’s generally struggled over a longer time period. Its expensive cost structure has contributed to an average operating margin of negative 2.5% over the last five years. Unprofitable business services companies require extra attention because they could get caught swimming naked when the tide goes out. It’s hard to trust that the business can endure a full cycle.
On the plus side, Grid Dynamics’s operating margin rose by 4.2 percentage points over the last five years, as its sales growth gave it operating leverage. Still, it will take much more for the company to reach long-term profitability.
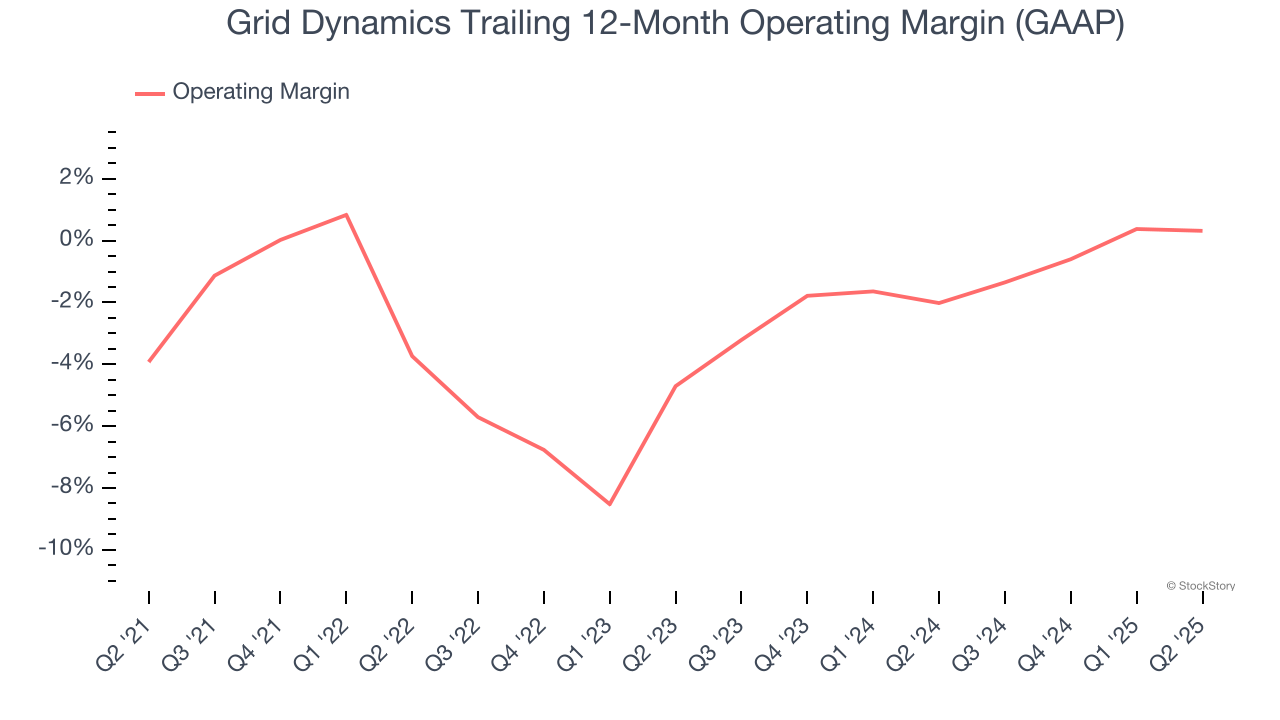
This quarter, Grid Dynamics generated a negative 0.1% operating margin.
Earnings Per Share
Revenue trends explain a company’s historical growth, but the long-term change in earnings per share (EPS) points to the profitability of that growth – for example, a company could inflate its sales through excessive spending on advertising and promotions.
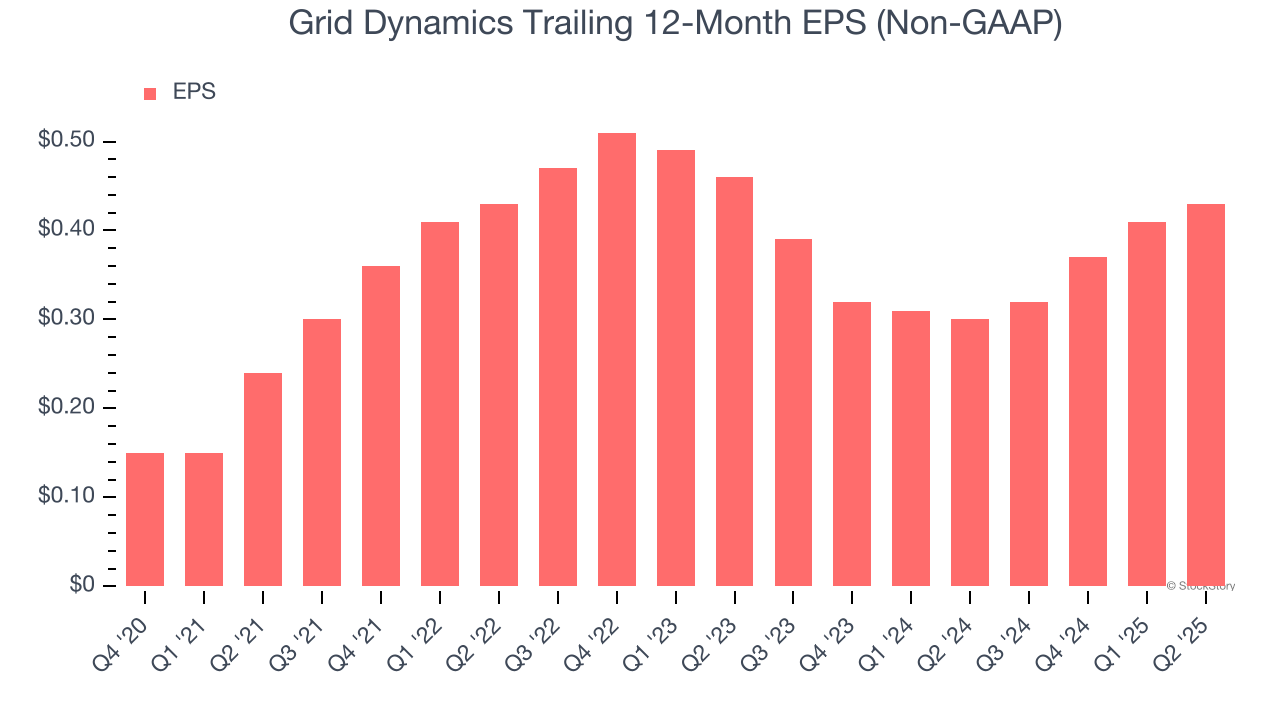
Grid Dynamics’s astounding 28.5% annual EPS growth over the last five years aligns with its revenue performance. This tells us its incremental sales were profitable.
Like with revenue, we analyze EPS over a more recent period because it can provide insight into an emerging theme or development for the business.
Grid Dynamics’s two-year annual EPS declines of 3.3% were bad and lower than its 10.4% two-year revenue growth.
Diving into the nuances of Grid Dynamics’s earnings can give us a better understanding of its performance. We mentioned earlier that Grid Dynamics’s operating margin was flat this quarter, but a two-year view shows its margin has declined by 1.8 percentage pointswhile its share count has grown 12.5%. This means the company not only became less efficient with its operating expenses but also diluted its shareholders. 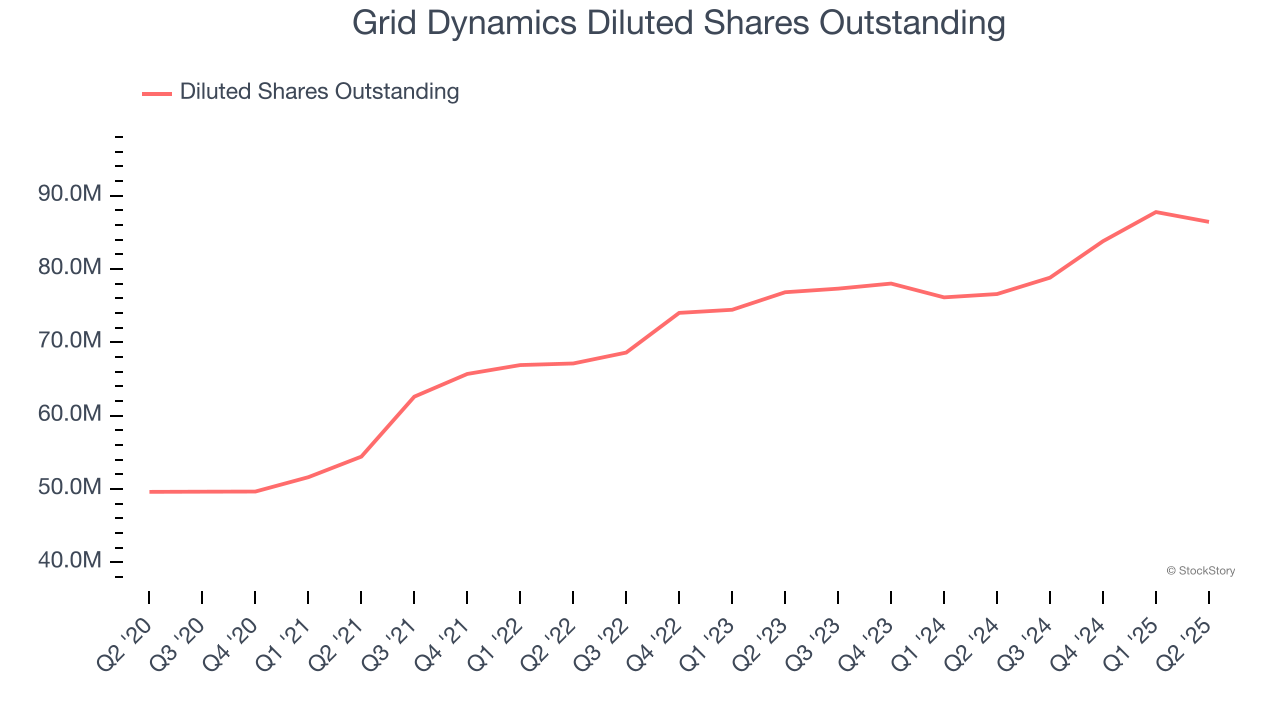
In Q2, Grid Dynamics reported adjusted EPS at $0.10, up from $0.08 in the same quarter last year. This print beat analysts’ estimates by 2.1%. Over the next 12 months, Wall Street expects Grid Dynamics to perform poorly. Analysts forecast its full-year EPS of $0.43 will hit $0.45.
Key Takeaways from Grid Dynamics’s Q2 Results
It was encouraging to see Grid Dynamics’s full-year revenue guidance beat analysts’ expectations. We were also happy its EPS outperformed Wall Street’s estimates. On the other hand, its revenue guidance for next quarter slightly missed. Zooming out, we think this was a mixed quarter. Investors were likely hoping for more, and shares traded down 2.5% to $9.25 immediately after reporting.
Is Grid Dynamics an attractive investment opportunity right now? The latest quarter does matter, but not nearly as much as longer-term fundamentals and valuation, when deciding if the stock is a buy. We cover that in our actionable full research report which you can read here, it’s free.