Fast-food chain Shake Shack (NYSE: SHAK) reported Q2 CY2025 results topping the market’s revenue expectations, with sales up 12.6% year on year to $356.5 million. Its non-GAAP profit of $0.44 per share was 16.9% above analysts’ consensus estimates.
Is now the time to buy Shake Shack? Find out by accessing our full research report, it’s free.
Shake Shack (SHAK) Q2 CY2025 Highlights:
- Revenue: $356.5 million vs analyst estimates of $353.4 million (12.6% year-on-year growth, 0.9% beat)
- Adjusted EPS: $0.44 vs analyst estimates of $0.38 (16.9% beat)
- Adjusted EBITDA: $58.9 million vs analyst estimates of $55.5 million (16.5% margin, 6.1% beat)
- Q3 revenue guidance: $361 million vs. analyst estimates of $364 million (miss)
- Operating Margin: 6.3%, up from 3.4% in the same quarter last year
- Free Cash Flow Margin: 7.5%, up from 6.5% in the same quarter last year
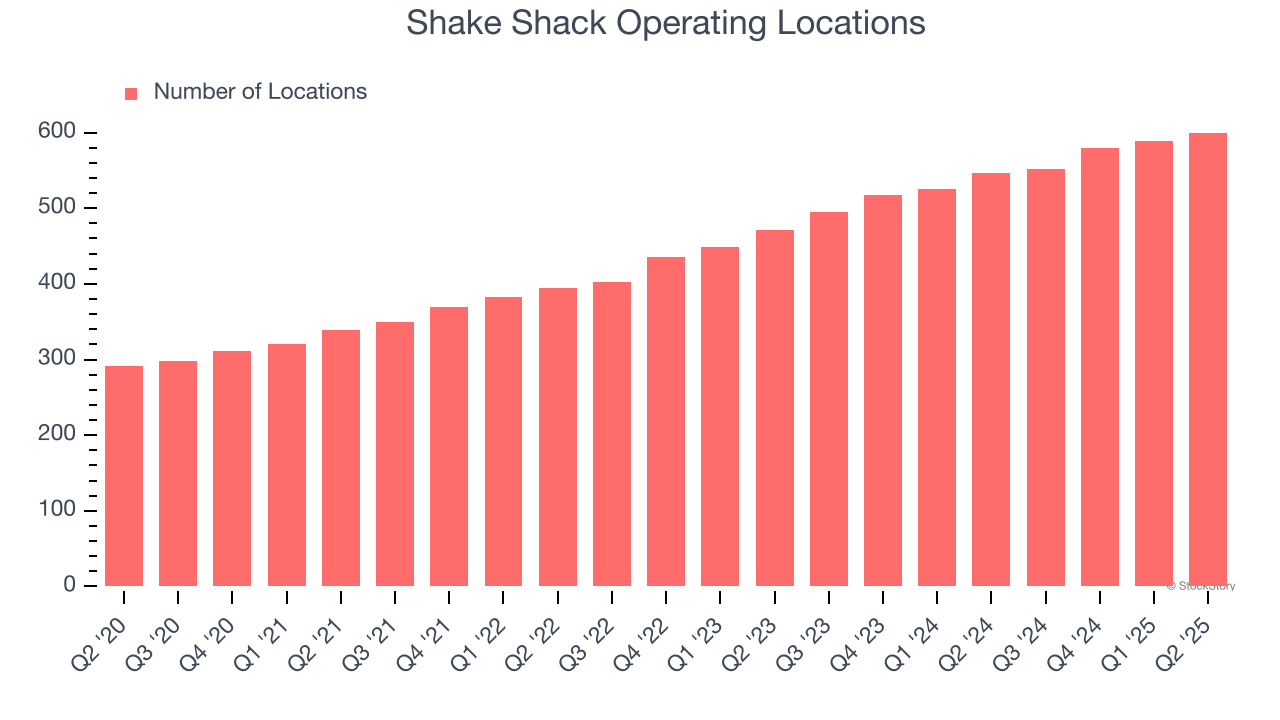
- Locations: 600 at quarter end, up from 547 in the same quarter last year
- Same-Store Sales rose 1.8% year on year (4% in the same quarter last year)
- Market Capitalization: $5.67 billion
NEW YORK--(BUSINESS WIRE)--Shake Shack Inc. (“Shake Shack” or the “Company”) (NYSE: SHAK) today announced the appointment of Jamie Griffin as Chief People Officer, effective immediately.
Company Overview
Started as a hot dog cart in New York City's Madison Square Park, Shake Shack (NYSE: SHAK) is a fast-food restaurant known for its burgers and milkshakes.
Revenue Growth
A company’s long-term performance is an indicator of its overall quality. Any business can put up a good quarter or two, but many enduring ones grow for years.
With $1.32 billion in revenue over the past 12 months, Shake Shack is a mid-sized restaurant chain, which sometimes brings disadvantages compared to larger competitors benefiting from better brand awareness and economies of scale. On the bright side, it can still flex high growth rates because it’s working from a smaller revenue base.
As you can see below, Shake Shack’s 16.5% annualized revenue growth over the last six years (we compare to 2019 to normalize for COVID-19 impacts) was excellent as it opened new restaurants and increased sales at existing, established dining locations.
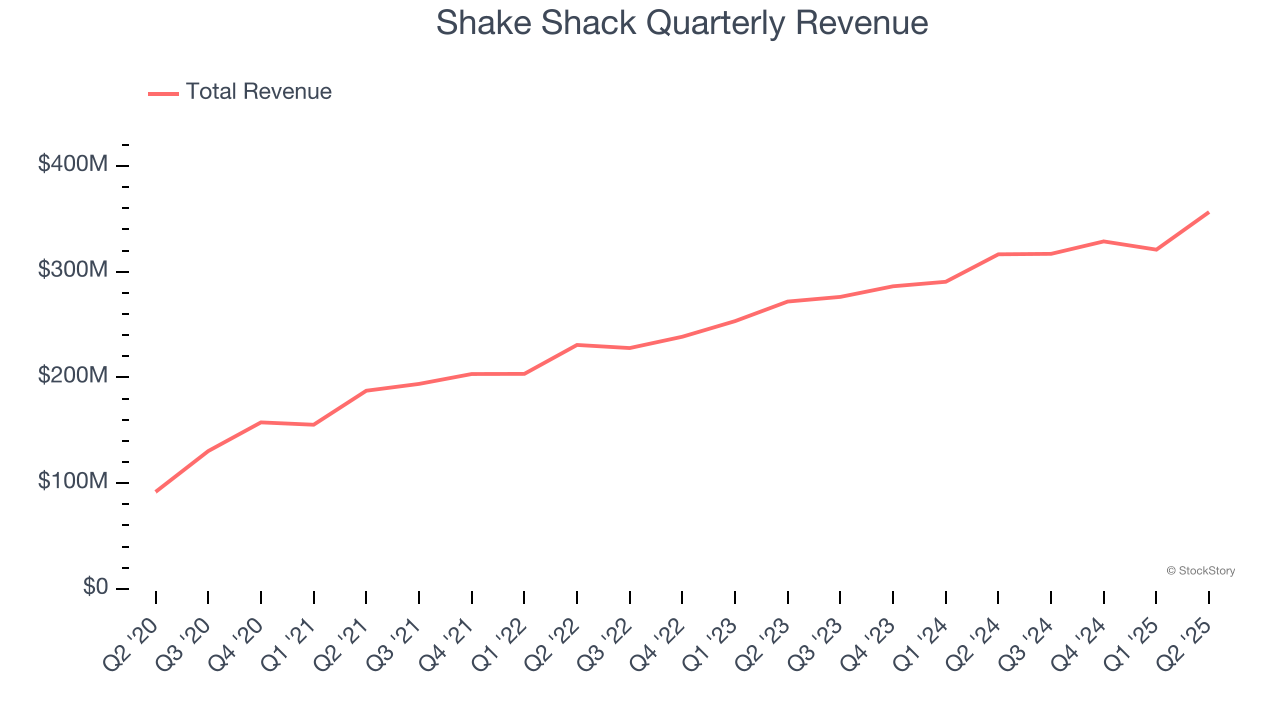
This quarter, Shake Shack reported year-on-year revenue growth of 12.6%, and its $356.5 million of revenue exceeded Wall Street’s estimates by 0.9%.
Looking ahead, sell-side analysts expect revenue to grow 17.4% over the next 12 months, similar to its six-year rate. This projection is commendable and suggests the market sees success for its menu offerings.
Software is eating the world and there is virtually no industry left that has been untouched by it. That drives increasing demand for tools helping software developers do their jobs, whether it be monitoring critical cloud infrastructure, integrating audio and video functionality, or ensuring smooth content streaming. Click here to access a free report on our 3 favorite stocks to play this generational megatrend.
Restaurant Performance
Number of Restaurants
A restaurant chain’s total number of dining locations influences how much it can sell and how quickly revenue can grow.
Shake Shack operated 600 locations in the latest quarter. It has opened new restaurants at a rapid clip over the last two years, averaging 15% annual growth, much faster than the broader restaurant sector. This gives it a chance to become a large, scaled business over time.
When a chain opens new restaurants, it usually means it’s investing for growth because there’s healthy demand for its meals and there are markets where its concepts have few or no locations.
Same-Store Sales
The change in a company's restaurant base only tells one side of the story. The other is the performance of its existing locations, which informs management teams whether they should expand or downsize their physical footprints. Same-store sales provides a deeper understanding of this issue because it measures organic growth at restaurants open for at least a year.
Shake Shack’s demand has been healthy for a restaurant chain over the last two years. On average, the company has grown its same-store sales by a robust 2.7% per year. This performance gives it the confidence to meaningfully expand its restaurant base.
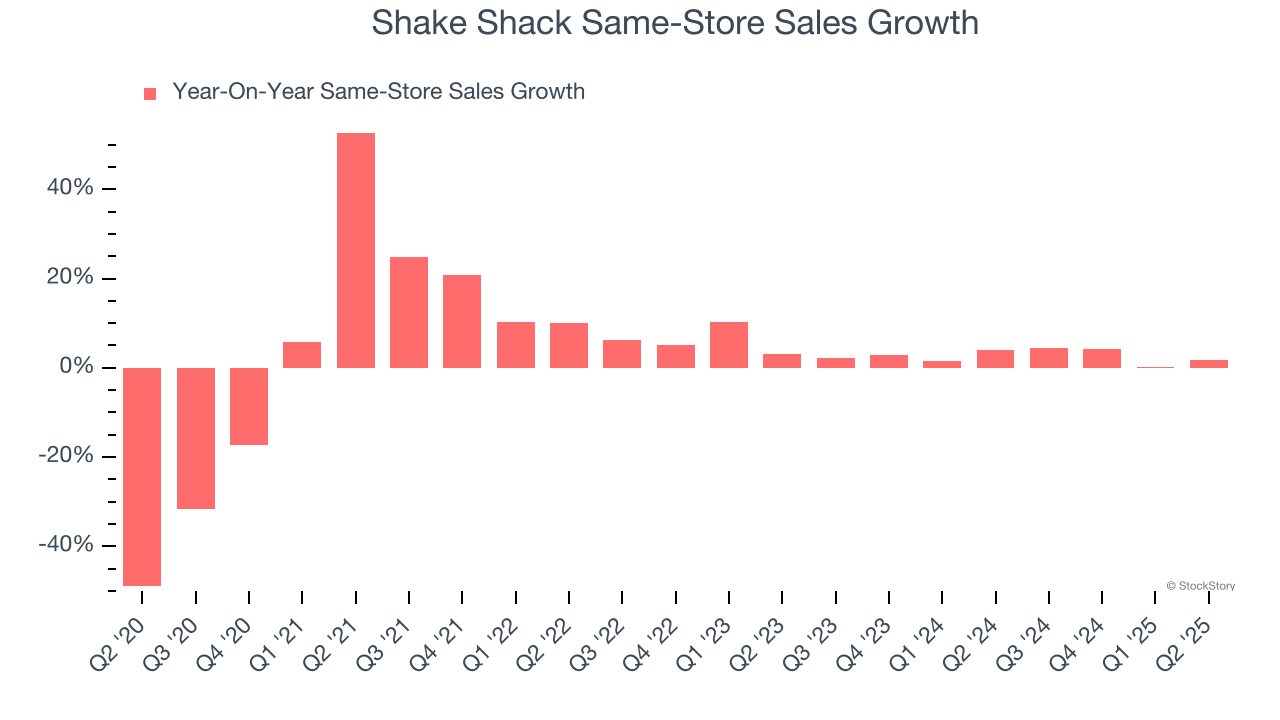
In the latest quarter, Shake Shack’s same-store sales rose 1.8% year on year. This performance was more or less in line with its historical levels.
Key Takeaways from Shake Shack’s Q2 Results
The quarter itself was solid, with revenue and EBITDA exceeding expectations. However, revenue guidance for next quarter missed, and this is weighing on shares. The stock traded down 11% to $125.50 immediately after reporting.
Is Shake Shack an attractive investment opportunity at the current price? The latest quarter does matter, but not nearly as much as longer-term fundamentals and valuation, when deciding if the stock is a buy. We cover that in our actionable full research report which you can read here, it’s free.