Satellite radio and media company Sirius XM (NASDAQ: SIRI) met Wall Street’s revenue expectations in Q2 CY2025, but sales fell by 1.8% year on year to $2.14 billion. The company’s outlook for the full year was close to analysts’ estimates with revenue guided to $8.5 billion at the midpoint. Its GAAP profit of $0.57 per share was 26.3% below analysts’ consensus estimates.
Is now the time to buy Sirius XM? Find out by accessing our full research report, it’s free.
Sirius XM (SIRI) Q2 CY2025 Highlights:
- Revenue: $2.14 billion vs analyst estimates of $2.13 billion (1.8% year-on-year decline, in line)
- EPS (GAAP): $0.57 vs analyst expectations of $0.77 (26.3% miss)
- Adjusted EBITDA: $668 million vs analyst estimates of $661.5 million (31.2% margin, 1% beat)
- The company reconfirmed its revenue guidance for the full year of $8.5 billion at the midpoint
- EBITDA guidance for the full year is $2.6 billion at the midpoint, in line with analyst expectations
- Operating Margin: 17.1%, down from 23.2% in the same quarter last year
- Free Cash Flow Margin: 18.8%, up from 15.7% in the same quarter last year
- Subscribers: 8.23 million
- Market Capitalization: $7.75 billion
Company Overview
Known for its commercial-free music channels, Sirius XM (NASDAQ: SIRI) is a broadcasting company that provides satellite radio and online radio services across North America.
Revenue Growth
A company’s long-term sales performance can indicate its overall quality. Any business can put up a good quarter or two, but the best consistently grow over the long haul. Over the last five years, Sirius XM grew its sales at a weak 1.6% compounded annual growth rate. This was below our standards and is a tough starting point for our analysis.
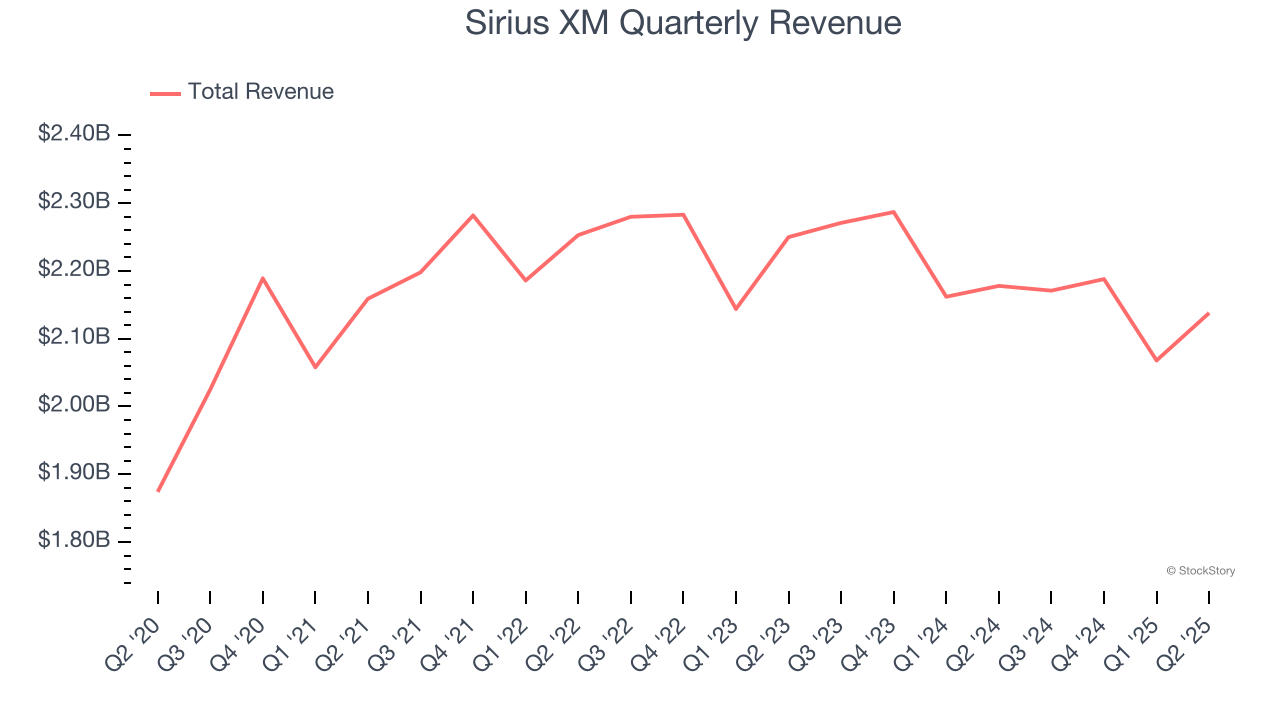
Long-term growth is the most important, but within consumer discretionary, product cycles are short and revenue can be hit-driven due to rapidly changing trends and consumer preferences. Sirius XM’s performance shows it grew in the past but relinquished its gains over the last two years, as its revenue fell by 2.2% annually. 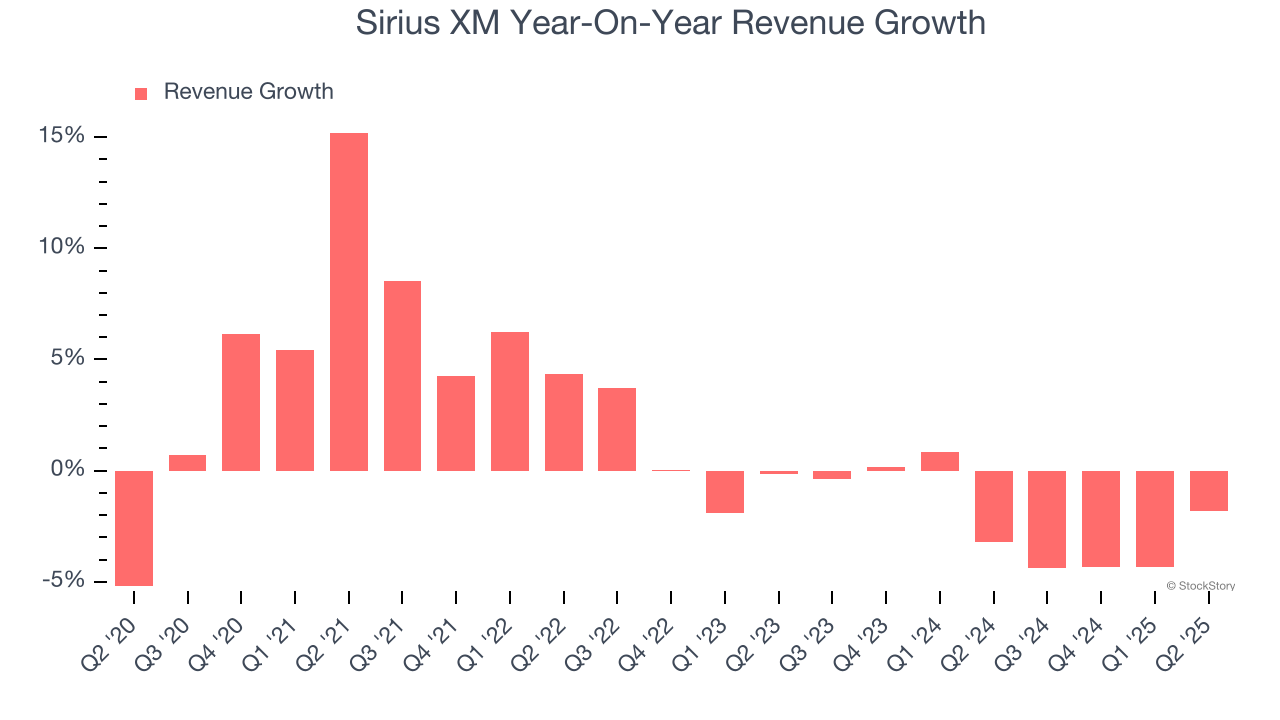
This quarter, Sirius XM reported a rather uninspiring 1.8% year-on-year revenue decline to $2.14 billion of revenue, in line with Wall Street’s estimates.
Looking ahead, sell-side analysts expect revenue to remain flat over the next 12 months. Although this projection suggests its newer products and services will spur better top-line performance, it is still below average for the sector.
Software is eating the world and there is virtually no industry left that has been untouched by it. That drives increasing demand for tools helping software developers do their jobs, whether it be monitoring critical cloud infrastructure, integrating audio and video functionality, or ensuring smooth content streaming. Click here to access a free report on our 3 favorite stocks to play this generational megatrend.
Operating Margin
Sirius XM’s operating margin has been trending down over the last 12 months and averaged 2% over the last two years. The company’s profitability was mediocre for a consumer discretionary business and shows it couldn’t pass its higher operating expenses onto its customers.
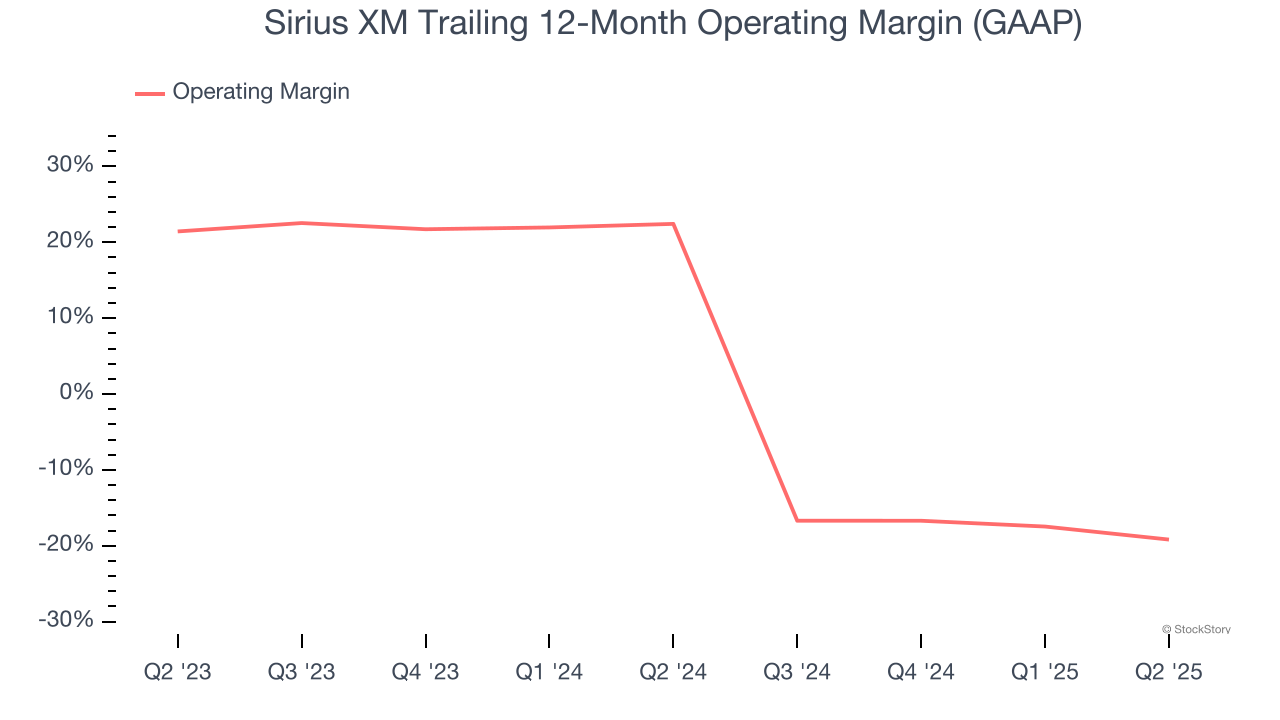
This quarter, Sirius XM generated an operating margin profit margin of 17.1%, down 6.1 percentage points year on year. This contraction shows it was less efficient because its expenses increased relative to its revenue.
Earnings Per Share
We track the long-term change in earnings per share (EPS) for the same reason as long-term revenue growth. Compared to revenue, however, EPS highlights whether a company’s growth is profitable.
Sadly for Sirius XM, its EPS declined by 38.1% annually over the last five years while its revenue grew by 1.6%. This tells us the company became less profitable on a per-share basis as it expanded due to non-fundamental factors such as interest expenses and taxes.
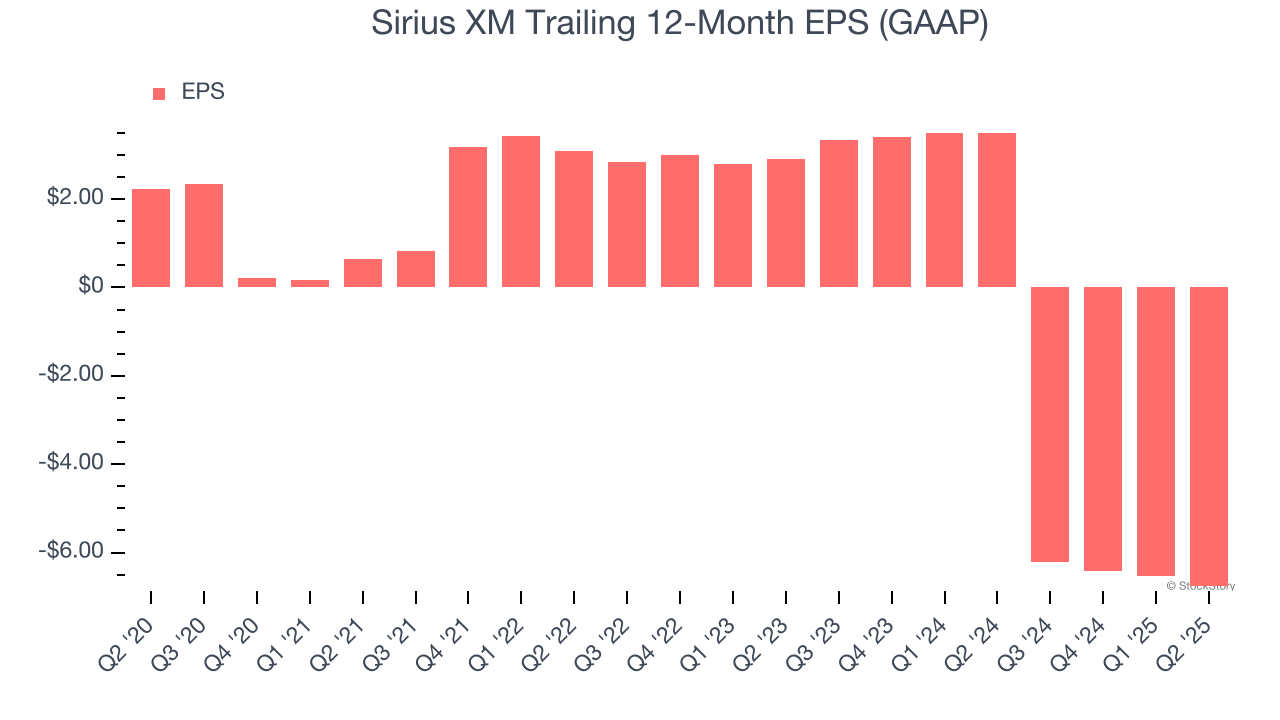
In Q2, Sirius XM reported EPS at $0.57, down from $0.81 in the same quarter last year. This print missed analysts’ estimates. Over the next 12 months, Wall Street is optimistic. Analysts forecast Sirius XM’s full-year EPS of negative $6.77 will flip to positive $3.02.
Key Takeaways from Sirius XM’s Q2 Results
Revenue was in line and adjusted EBITDA beat slightly. Looking ahead, the company reiterated full-year revenue guidance and EBITDA guidance met expectations. Overall, this was a quarter without many surprises. The stock remained flat at $22.88 immediately after reporting.
Sirius XM may have had a tough quarter, but does that actually create an opportunity to invest right now? When making that decision, it’s important to consider its valuation, business qualities, as well as what has happened in the latest quarter. We cover that in our actionable full research report which you can read here, it’s free.