Document technology company Xerox (NASDAQ: XRX) beat Wall Street’s revenue expectations in Q2 CY2025, but sales were flat year on year at $1.58 billion. Its non-GAAP profit of $3 per share was significantly above analysts’ consensus estimates.
Is now the time to buy Xerox? Find out by accessing our full research report, it’s free.
Xerox (XRX) Q2 CY2025 Highlights:
- Lexmark acquisition completed
- Revenue: $1.58 billion vs analyst estimates of $1.55 billion (flat year on year, 1.6% beat)
- Adjusted EPS: $3 vs analyst estimates of $0.07 (significant beat largely due to Lexmark acquisition)
- Adjusted EBITDA: $154 million vs analyst estimates of $105 million (9.8% margin, 46.7% beat largely due to Lexmark acquisition)
- Full-year guidance: operating margin and FCF guidance lowered, includes "$30 to 35 million of expected tariff-related expenses, net of mitigation efforts, modest Lexmark-related synergies and a slightly more conservative Print equipment demand outlook amid ongoing tariff and government policy-related uncertainty"
- Operating Margin: 5.3%, up from 3.7% in the same quarter last year
- Free Cash Flow was -$30 million, down from $115 million in the same quarter last year
- Market Capitalization: $656.6 million
Company Overview
Pioneering the modern office copier and inventing technologies like Ethernet and the laser printer, Xerox (NASDAQ: XRX) provides document management systems, printing technology, and workplace solutions to businesses of all sizes across the globe.
Revenue Growth
Examining a company’s long-term performance can provide clues about its quality. Any business can put up a good quarter or two, but the best consistently grow over the long haul.
With $6.17 billion in revenue over the past 12 months, Xerox is one of the larger companies in the business services industry and benefits from a well-known brand that influences purchasing decisions. However, its scale is a double-edged sword because finding new avenues for growth becomes difficult when you already have a substantial market presence. To expand meaningfully, Xerox likely needs to tweak its prices, innovate with new offerings, or enter new markets.
As you can see below, Xerox’s demand was weak over the last five years. Its sales fell by 4.9% annually, a poor baseline for our analysis.
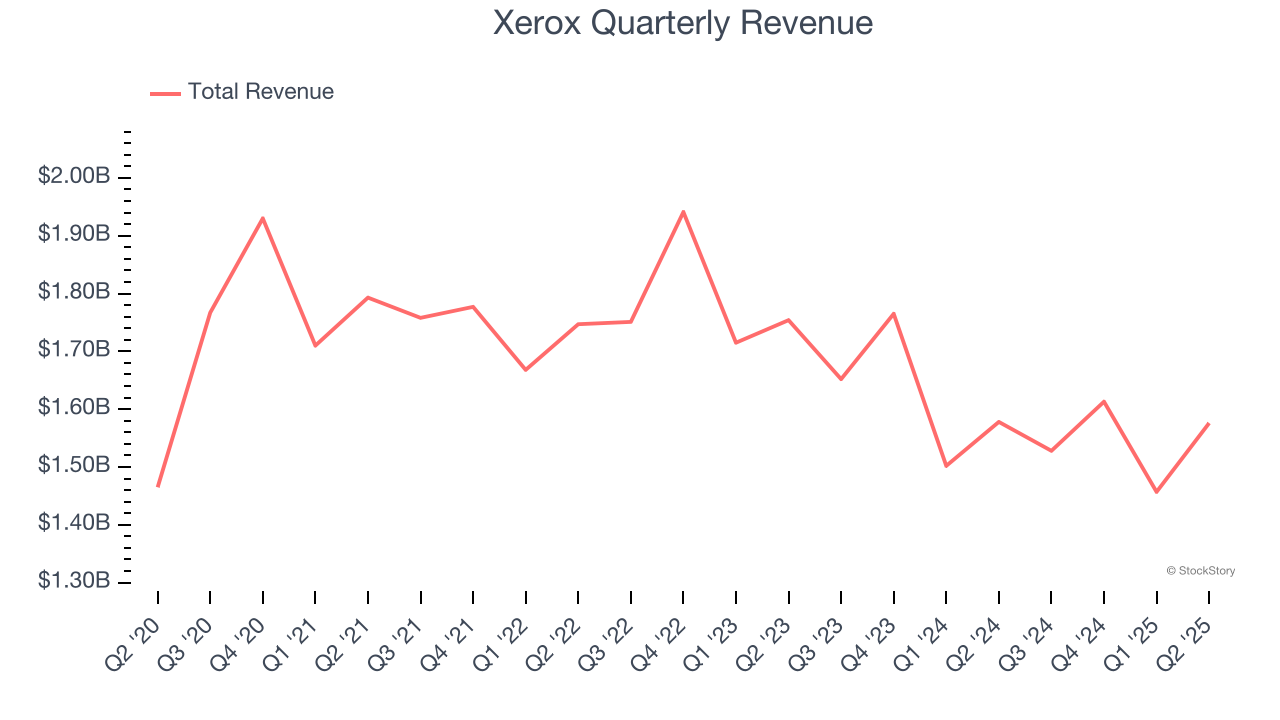
Long-term growth is the most important, but within business services, a half-decade historical view may miss new innovations or demand cycles. Xerox’s recent performance shows its demand remained suppressed as its revenue has declined by 7.1% annually over the last two years. 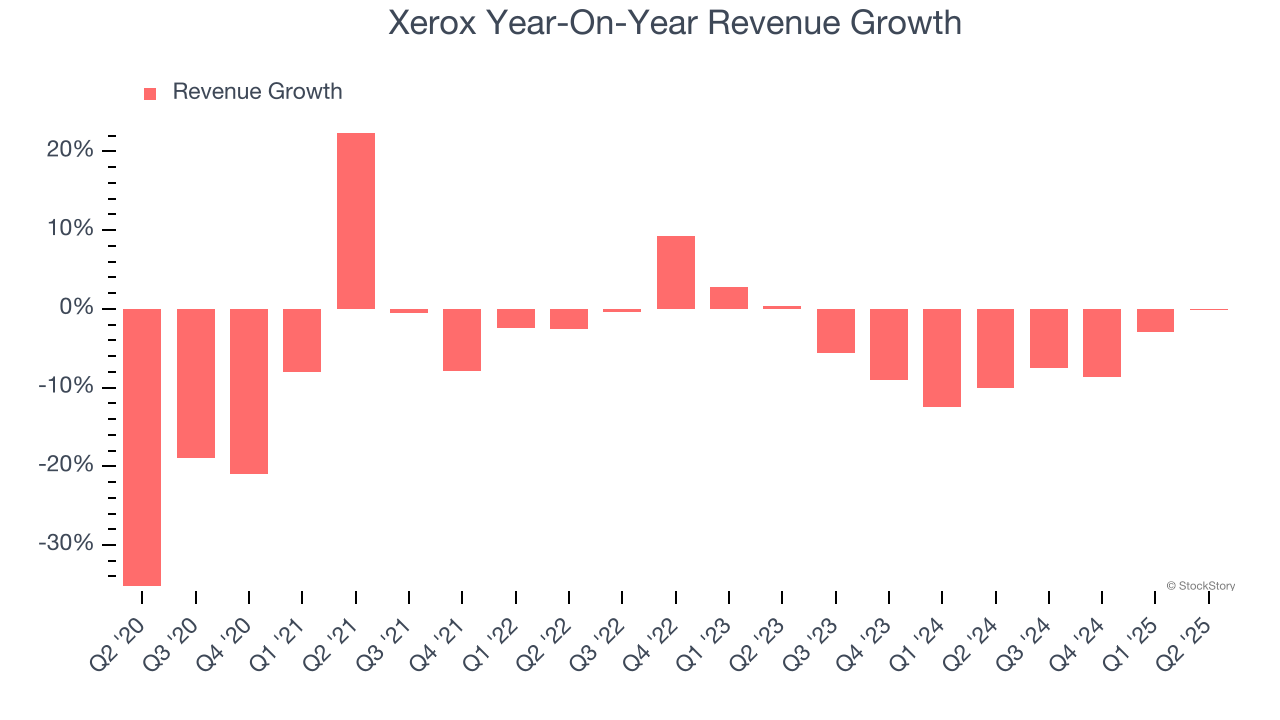
This quarter, Xerox’s $1.58 billion of revenue was flat year on year but beat Wall Street’s estimates by 1.6%.
Looking ahead, sell-side analysts expect revenue to remain flat over the next 12 months. While this projection suggests its newer products and services will spur better top-line performance, it is still below average for the sector.
Unless you’ve been living under a rock, it should be obvious by now that generative AI is going to have a huge impact on how large corporations do business. While Nvidia and AMD are trading close to all-time highs, we prefer a lesser-known (but still profitable) stock benefiting from the rise of AI. Click here to access our free report one of our favorites growth stories.
Operating Margin
Although Xerox was profitable this quarter from an operational perspective, it’s generally struggled over a longer time period. Its expensive cost structure has contributed to an average operating margin of negative 4.3% over the last five years. Unprofitable business services companies require extra attention because they could get caught swimming naked when the tide goes out. It’s hard to trust that the business can endure a full cycle.
Analyzing the trend in its profitability, Xerox’s operating margin decreased by 20.5 percentage points over the last five years. Xerox’s performance was poor no matter how you look at it - it shows that costs were rising and it couldn’t pass them onto its customers.
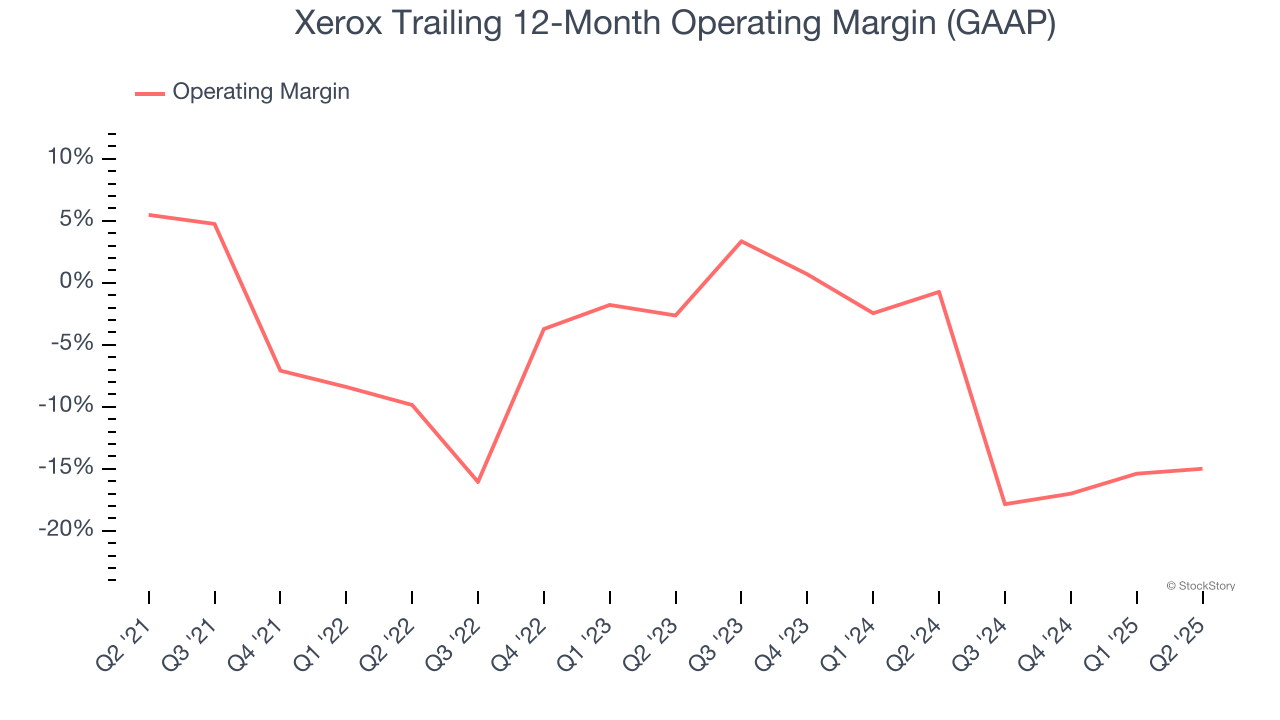
In Q2, Xerox generated an operating margin profit margin of 5.3%, up 1.6 percentage points year on year. This increase was a welcome development and shows it was more efficient.
Earnings Per Share
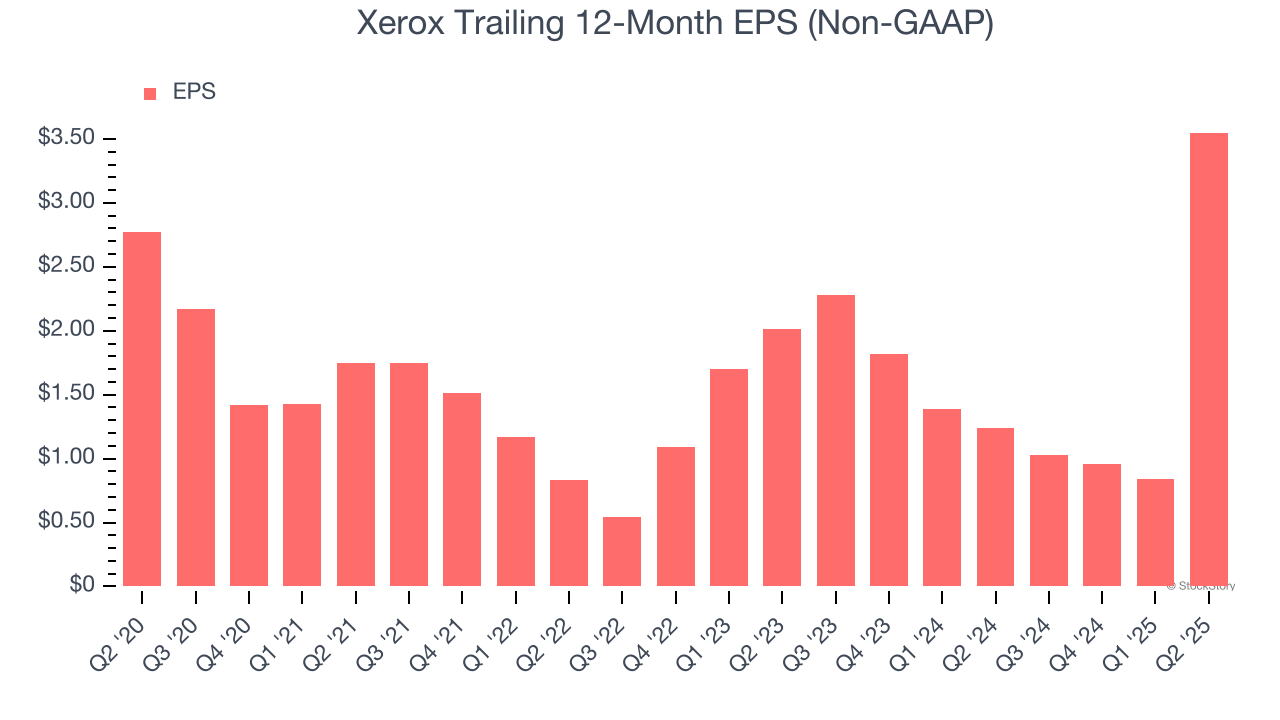
Revenue trends explain a company’s historical growth, but the long-term change in earnings per share (EPS) points to the profitability of that growth – for example, a company could inflate its sales through excessive spending on advertising and promotions.
Xerox’s EPS grew at an unimpressive 5.1% compounded annual growth rate over the last five years. On the bright side, this performance was better than its 4.9% annualized revenue declines and tells us management adapted its cost structure in response to a challenging demand environment.
Diving into the nuances of Xerox’s earnings can give us a better understanding of its performance. A five-year view shows that Xerox has repurchased its stock, shrinking its share count by 43.5%. This tells us its EPS outperformed its revenue not because of increased operational efficiency but financial engineering, as buybacks boost per share earnings. 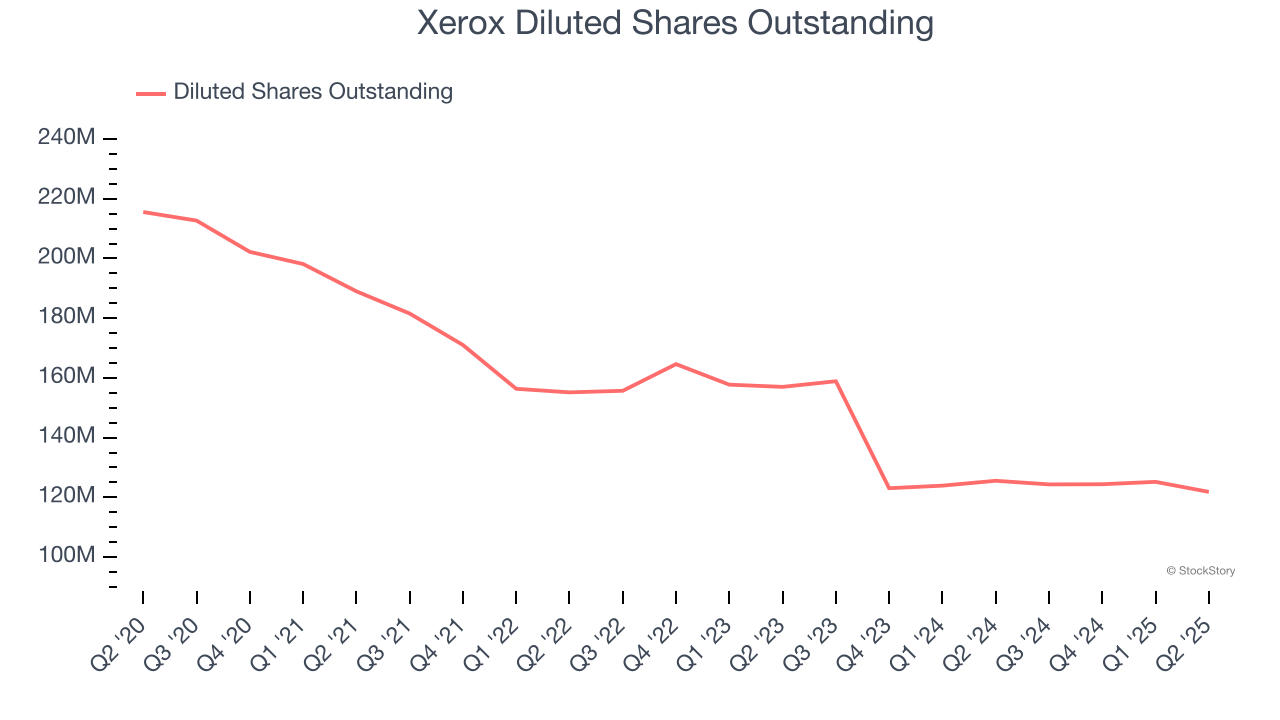
Like with revenue, we analyze EPS over a shorter period to see if we are missing a change in the business.
For Xerox, its two-year annual EPS growth of 32.9% was higher than its five-year trend. This acceleration made it one of the faster-growing business services companies in recent history.
In Q2, Xerox reported adjusted EPS at $3, up from $0.29 in the same quarter last year. This print easily cleared analysts’ estimates, and shareholders should be content with the results. Over the next 12 months, Wall Street expects Xerox’s full-year EPS of $3.55 to shrink by 56.3%.
Key Takeaways from Xerox’s Q2 Results
We were impressed by how significantly Xerox blew past analysts’ EPS expectations this quarter. We were also happy its revenue outperformed Wall Street’s estimates. On the other hand, previously-provided full-year operating margin and free cash flow guidance was lowered to reflect "$30 to 35 million of expected tariff-related expenses, net of mitigation efforts, modest Lexmark-related synergies and a slightly more conservative Print equipment demand outlook amid ongoing tariff and government policy-related uncertainty". Investors were likely hoping for more, and shares traded down 4.2% to $5 immediately following the results.
So do we think Xerox is an attractive buy at the current price? What happened in the latest quarter matters, but not as much as longer-term business quality and valuation, when deciding whether to invest in this stock. We cover that in our actionable full research report which you can read here, it’s free.


