Wrapping up Q1 earnings, we look at the numbers and key takeaways for the industrial packaging stocks, including Silgan Holdings (NYSE: SLGN) and its peers.
Industrial packaging companies have built competitive advantages from economies of scale that lead to advantaged purchasing and capital investments that are difficult and expensive to replicate. Recently, eco-friendly packaging and conservation are driving customers preferences and innovation. For example, plastic is not as desirable a material as it once was. Despite being integral to consumer goods ranging from beer to toothpaste to laundry detergent, these companies are still at the whim of the macro, especially consumer health and consumer willingness to spend.
The 8 industrial packaging stocks we track reported a satisfactory Q1. As a group, revenues beat analysts’ consensus estimates by 0.9%.
Thankfully, share prices of the companies have been resilient as they are up 8.2% on average since the latest earnings results.
Silgan Holdings (NYSE: SLGN)
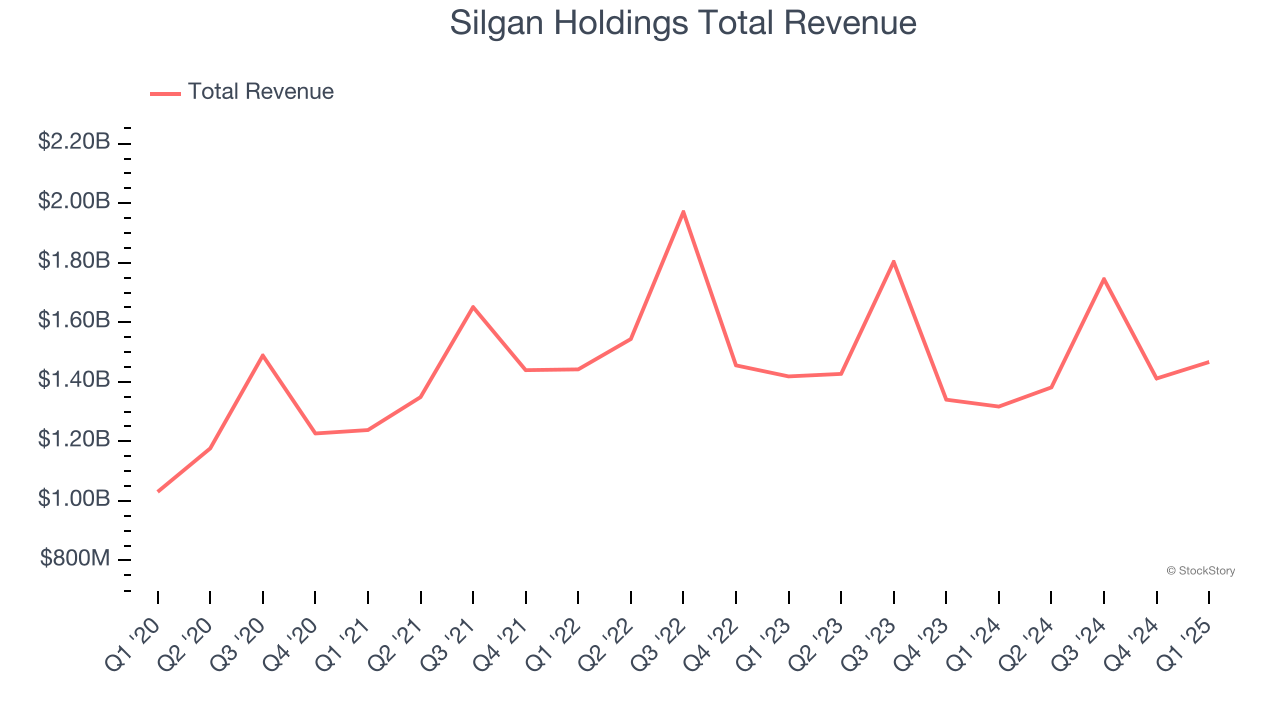
Established in 1987, Silgan Holdings (NYSE: SLGN) is a supplier of rigid packaging for consumer goods products, specializing in metal containers, closures, and plastic packaging.
Silgan Holdings reported revenues of $1.47 billion, up 11.4% year on year. This print fell short of analysts’ expectations by 0.6%. Overall, it was a slower quarter for the company with a slight miss of analysts’ organic revenue and EBITDA estimates.
"Our team delivered another quarter of record results with adjusted EPS growth of 19% that was near the high end of our expectation in the first quarter, as volume growth and outstanding operating performance across all segments, strong results from the Weener acquisition and continued execution of our cost reduction program drove our success. Once again, the strength of our teams, the power of our diverse portfolio and the success of our unique value creation strategy continue to set Silgan apart in the market," said Adam Greenlee, President and CEO.
Interestingly, the stock is up 8% since reporting and currently trades at $56.67.
Read our full report on Silgan Holdings here, it’s free.
Best Q1: Ball (NYSE: BALL)
Started with a $200 loan in 1880, Ball (NYSE: BLL) manufactures aluminum packaging for beverages, personal care, and household products as well as aerospace systems and other technologies.
Ball reported revenues of $3.10 billion, up 7.8% year on year, outperforming analysts’ expectations by 6.7%. The business had a stunning quarter with an impressive beat of analysts’ organic revenue and adjusted operating income estimates.
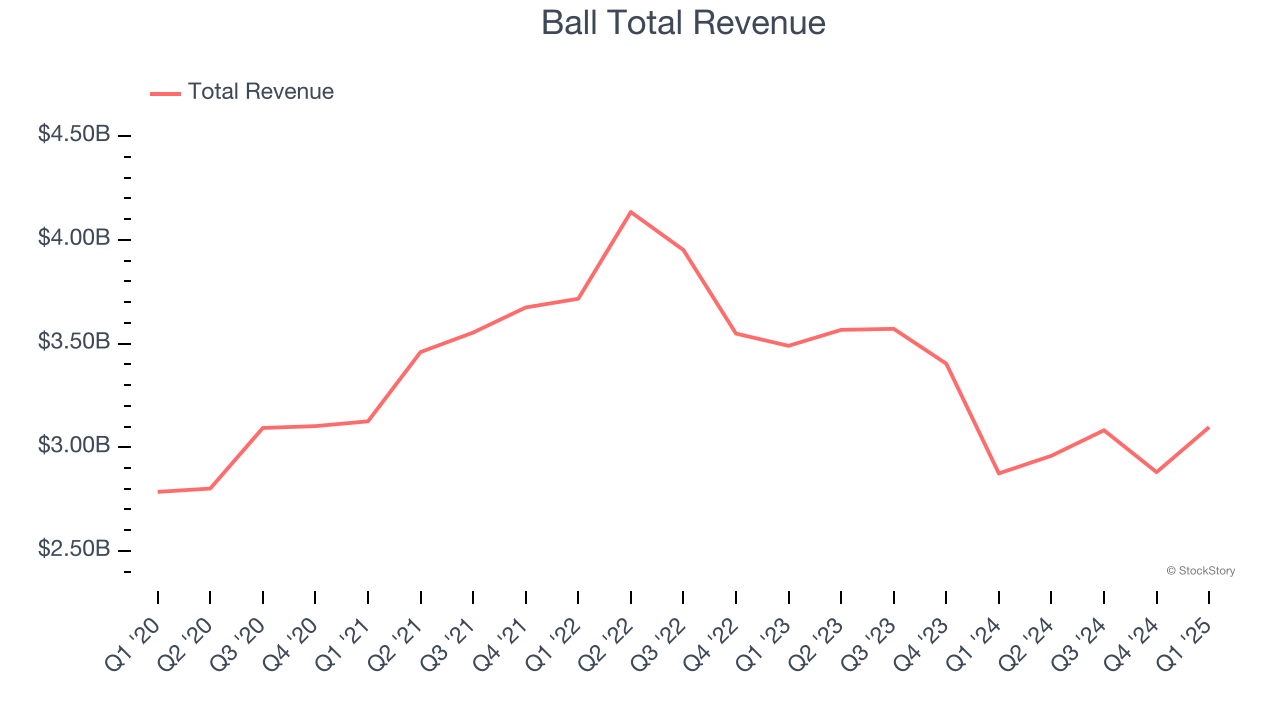
Ball achieved the biggest analyst estimates beat among its peers. The market seems happy with the results as the stock is up 13.3% since reporting. It currently trades at $58.73.
Is now the time to buy Ball? Access our full analysis of the earnings results here, it’s free.
Weakest Q1: Graphic Packaging Holding (NYSE: GPK)
Founded in 1991, Graphic Packaging (NYSE: GPK) is a provider of paper-based packaging solutions for a wide range of products.
Graphic Packaging Holding reported revenues of $2.12 billion, down 6.2% year on year, in line with analysts’ expectations. It was a softer quarter as it posted full-year revenue guidance missing analysts’ expectations.
Graphic Packaging Holding delivered the slowest revenue growth and weakest full-year guidance update in the group. As expected, the stock is down 12.9% since the results and currently trades at $22.02.
Read our full analysis of Graphic Packaging Holding’s results here.
International Paper (NYSE: IP)
Established in 1898, International Paper (NYSE: IP) produces containerboard, pulp, paper, and materials used in packaging and printing applications.
International Paper reported revenues of $5.90 billion, up 27.8% year on year. This print came in 1.5% below analysts' expectations. It was a softer quarter as it also recorded a significant miss of analysts’ adjusted operating income and EPS estimates.
International Paper scored the fastest revenue growth but had the weakest performance against analyst estimates among its peers. The stock is up 5.9% since reporting and currently trades at $50.43.
Read our full, actionable report on International Paper here, it’s free.
Avery Dennison (NYSE: AVY)
Founded as Kum Kleen Products, Avery Dennison (NYSE: AVY) is a manufacturer of adhesive materials, display graphics, and packaging products, serving various industries.
Avery Dennison reported revenues of $2.15 billion, flat year on year. This result was in line with analysts’ expectations. Taking a step back, it was a slower quarter as it recorded EPS guidance for next quarter missing analysts’ expectations.
The stock is up 4.7% since reporting and currently trades at $183.24.
Read our full, actionable report on Avery Dennison here, it’s free.
Market Update
The Fed’s interest rate hikes throughout 2022 and 2023 have successfully cooled post-pandemic inflation, bringing it closer to the 2% target. Inflationary pressures have eased without tipping the economy into a recession, suggesting a soft landing. This stability, paired with recent rate cuts (0.5% in September 2024 and 0.25% in November 2024), fueled a strong year for the stock market in 2024. The markets surged further after Donald Trump’s presidential victory in November, with major indices reaching record highs in the days following the election. Still, questions remain about the direction of economic policy, as potential tariffs and corporate tax changes add uncertainty for 2025.
Want to invest in winners with rock-solid fundamentals? Check out our 9 Best Market-Beating Stocks and add them to your watchlist. These companies are poised for growth regardless of the political or macroeconomic climate.