
Over the past six months, Trinity’s shares (currently trading at $29.03) have posted a disappointing 17.8% loss, well below the S&P 500’s 6.2% gain. This was partly driven by its softer quarterly results and may have investors wondering how to approach the situation.
Is there a buying opportunity in Trinity, or does it present a risk to your portfolio? See what our analysts have to say in our full research report, it’s free.
Why Is Trinity Not Exciting?
Even though the stock has become cheaper, we're cautious about Trinity. Here are three reasons why TRN doesn't excite us and a stock we'd rather own.
1. Revenue Spiraling Downwards
A company’s long-term performance is an indicator of its overall quality. Any business can put up a good quarter or two, but the best consistently grow over the long haul. Trinity struggled to consistently generate demand over the last five years as its sales dropped at a 1.1% annual rate. This was below our standards and is a sign of lacking business quality. 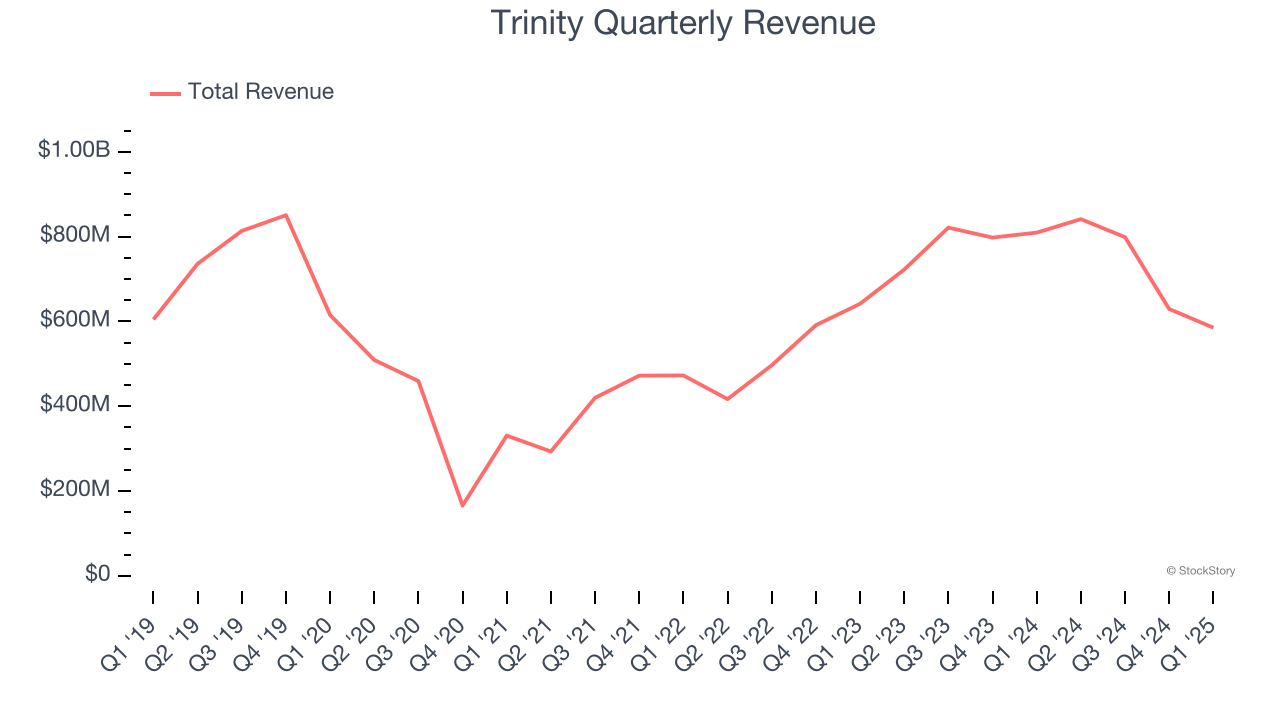
2. Cash Burn Ignites Concerns
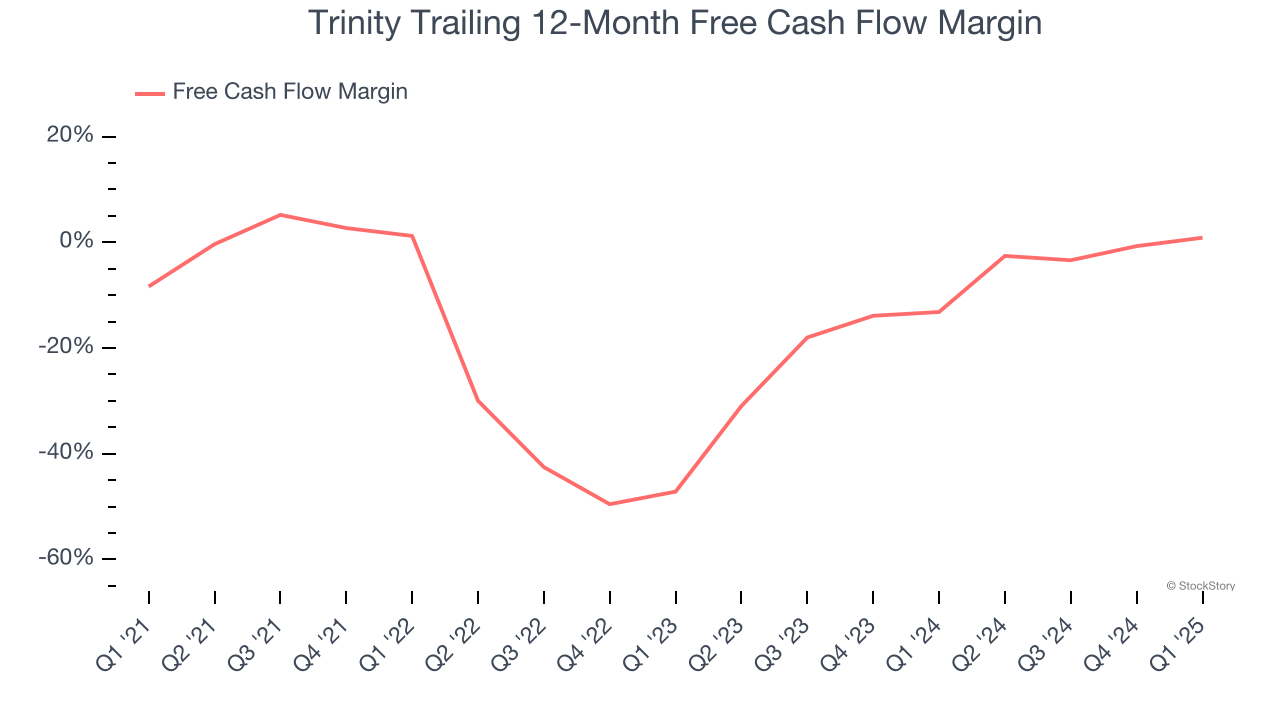
If you’ve followed StockStory for a while, you know we emphasize free cash flow. Why, you ask? We believe that in the end, cash is king, and you can’t use accounting profits to pay the bills.
Trinity’s demanding reinvestments have drained its resources over the last five years, putting it in a pinch and limiting its ability to return capital to investors. Its free cash flow margin averaged negative 13.3%, meaning it lit $13.34 of cash on fire for every $100 in revenue. This is a stark contrast from its operating margin, and its investments in working capital/capital expenditures are the primary culprit.
3. High Debt Levels Increase Risk
As long-term investors, the risk we care about most is the permanent loss of capital, which can happen when a company goes bankrupt or raises money from a disadvantaged position. This is separate from short-term stock price volatility, something we are much less bothered by.
Trinity’s $6.21 billion of debt exceeds the $94.9 million of cash on its balance sheet. Furthermore, its 8× net-debt-to-EBITDA ratio (based on its EBITDA of $796.2 million over the last 12 months) shows the company is overleveraged.
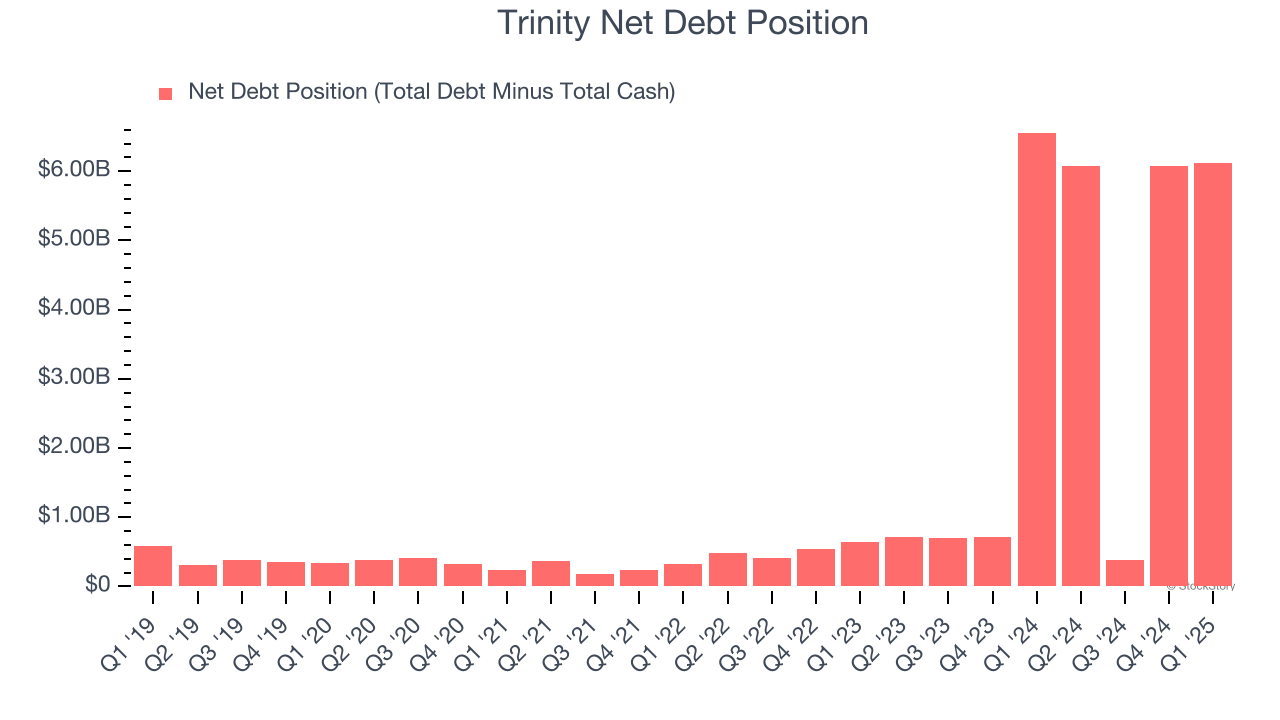
At this level of debt, incremental borrowing becomes increasingly expensive and credit agencies could downgrade the company’s rating if profitability falls. Trinity could also be backed into a corner if the market turns unexpectedly – a situation we seek to avoid as investors in high-quality companies.
We hope Trinity can improve its balance sheet and remain cautious until it increases its profitability or pays down its debt.
Final Judgment
Trinity isn’t a terrible business, but it doesn’t pass our quality test. Following the recent decline, the stock trades at 4.4× forward EV-to-EBITDA (or $29.03 per share). This valuation is reasonable, but the company’s shakier fundamentals present too much downside risk. We're pretty confident there are superior stocks to buy right now. We’d suggest looking at one of Charlie Munger’s all-time favorite businesses.
Stocks We Would Buy Instead of Trinity
Donald Trump’s victory in the 2024 U.S. Presidential Election sent major indices to all-time highs, but stocks have retraced as investors debate the health of the economy and the potential impact of tariffs.
While this leaves much uncertainty around 2025, a few companies are poised for long-term gains regardless of the political or macroeconomic climate, like our Top 5 Strong Momentum Stocks for this week. This is a curated list of our High Quality stocks that have generated a market-beating return of 183% over the last five years (as of March 31st 2025).
Stocks that made our list in 2020 include now familiar names such as Nvidia (+1,545% between March 2020 and March 2025) as well as under-the-radar businesses like the once-small-cap company Exlservice (+354% five-year return). Find your next big winner with StockStory today.


