
Comerica currently trades at $62.95 per share and has shown little upside over the past six months, posting a middling return of 1.1%.
Is now the time to buy Comerica, or should you be careful about including it in your portfolio? Get the full breakdown from our expert analysts, it’s free.
Why Do We Think Comerica Will Underperform?
We're sitting this one out for now. Here are three reasons why we avoid CMA and a stock we'd rather own.
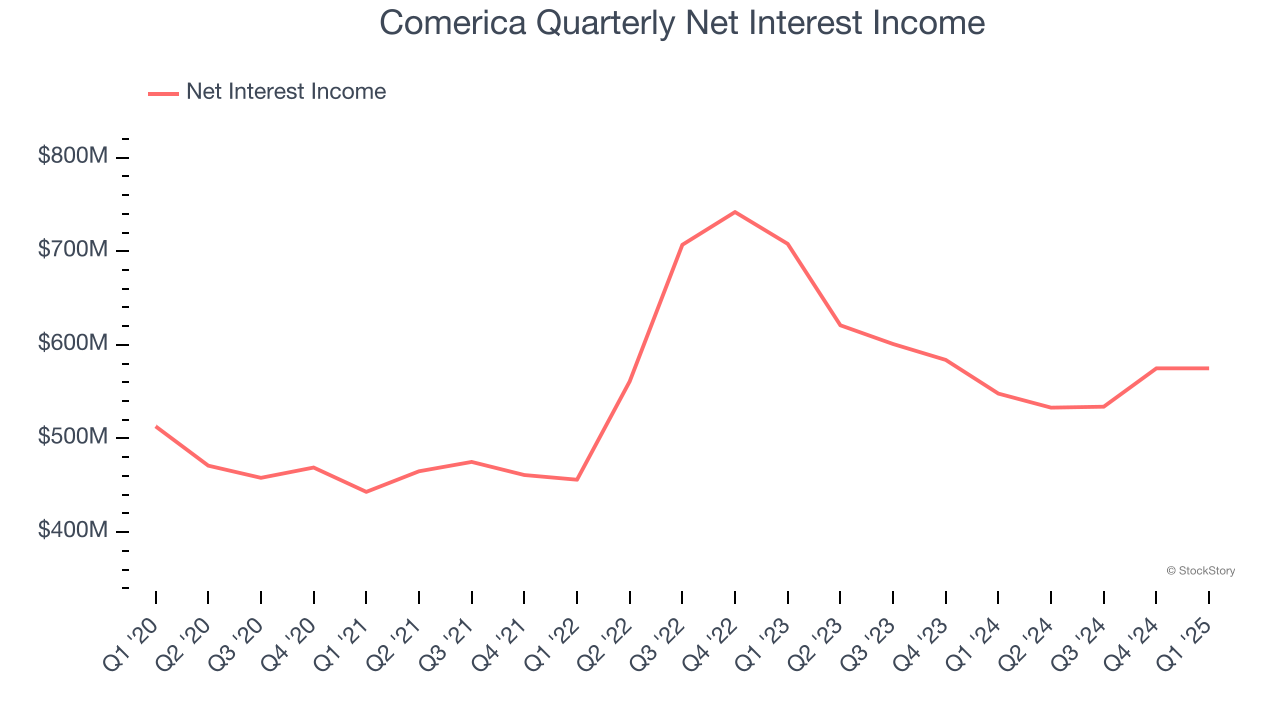
1. Net Interest Income Points to Soft Demand
Our experience and research show the market cares primarily about a bank’s net interest income growth as non-interest income is considered a lower-quality and non-recurring revenue source.
Comerica’s net interest income has grown at a 4.8% annualized rate over the last four years, worse than the broader bank industry. Its growth was driven by both an increase in its outstanding loans and net interest margin, which represents how much a bank earns in relation to its outstanding loan book.
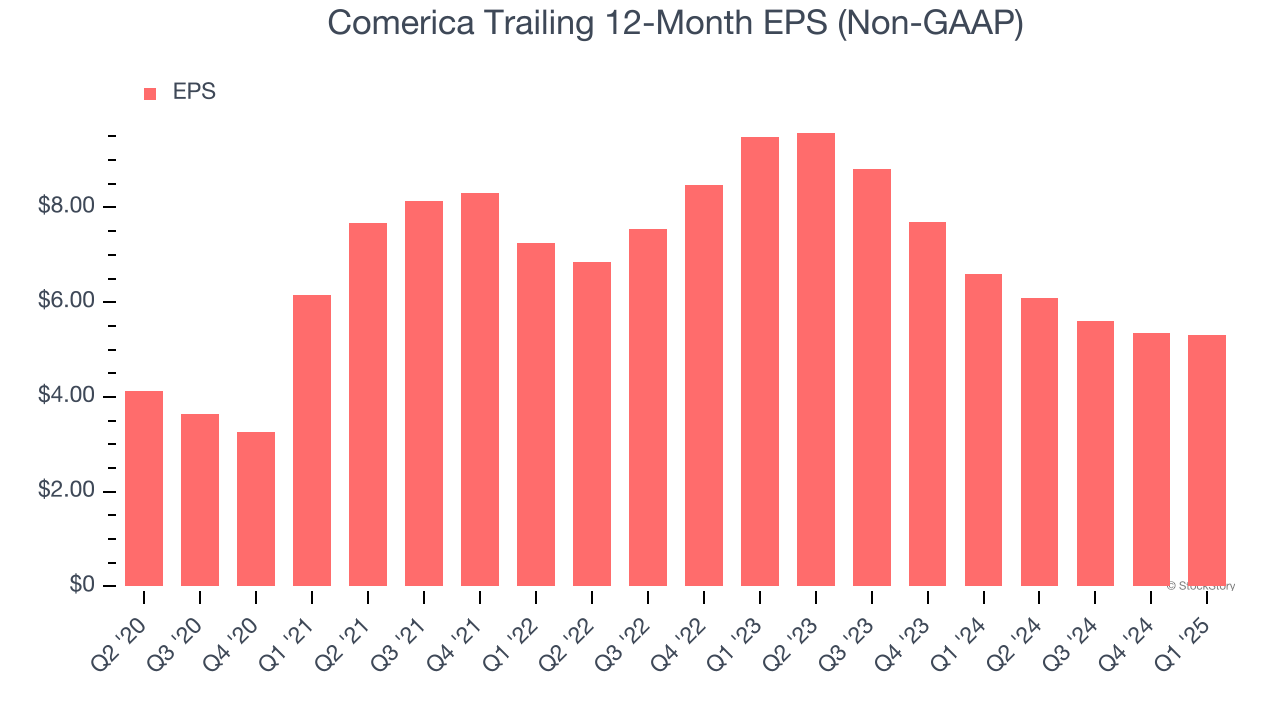
2. EPS Barely Growing
We track the long-term change in earnings per share (EPS) because it highlights whether a company’s growth is profitable.
Comerica’s EPS grew at an unimpressive 2.8% compounded annual growth rate over the last five years. On the bright side, this performance was better than its flat revenue and tells us management responded to softer demand by adapting its cost structure.
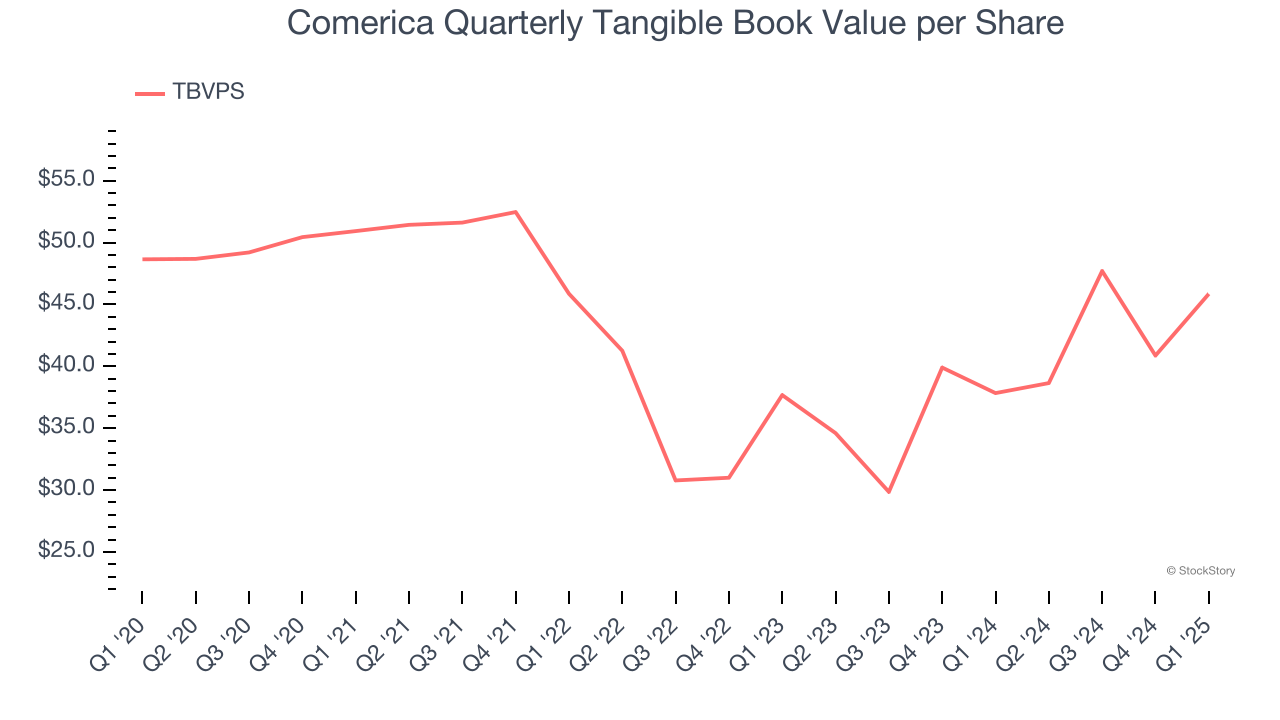
3. TBVPS Growth Demonstrates Strong Asset Foundation
We consider tangible book value per share (TBVPS) the most important metric to track for banks. TBVPS represents the real, liquid net worth per share of a bank, excluding intangible assets that have debatable value upon liquidation.
Although Comerica’s TBVPS declined at a 1.2% annual clip over the last five years. the good news is that its growth inflected positive over the past two years as TBVPS grew at a decent 10.3% annual clip (from $37.68 to $45.85 per share).
Final Judgment
We cheer for all companies supporting the economy, but in the case of Comerica, we’ll be cheering from the sidelines. That said, the stock currently trades at 1.2× forward P/B (or $62.95 per share). This multiple tells us a lot of good news is priced in - we think there are better stocks to buy right now. We’d suggest looking at a safe-and-steady industrials business benefiting from an upgrade cycle.
Stocks We Would Buy Instead of Comerica
The market surged in 2024 and reached record highs after Donald Trump’s presidential victory in November, but questions about new economic policies are adding much uncertainty for 2025.
While the crowd speculates what might happen next, we’re homing in on the companies that can succeed regardless of the political or macroeconomic environment. Put yourself in the driver’s seat and build a durable portfolio by checking out our Top 5 Strong Momentum Stocks for this week. This is a curated list of our High Quality stocks that have generated a market-beating return of 183% over the last five years (as of March 31st 2025).
Stocks that made our list in 2020 include now familiar names such as Nvidia (+1,545% between March 2020 and March 2025) as well as under-the-radar businesses like the once-small-cap company Comfort Systems (+782% five-year return). Find your next big winner with StockStory today.