Theater company AMC Entertainment (NYSE: AMC) beat Wall Street’s revenue expectations in Q2 CY2025, with sales up 35.6% year on year to $1.40 billion. Its non-GAAP loss of $0 per share was significantly above analysts’ consensus estimates.
Is now the time to buy AMC Entertainment? Find out by accessing our full research report, it’s free.
AMC Entertainment (AMC) Q2 CY2025 Highlights:
- Revenue: $1.40 billion vs analyst estimates of $1.36 billion (35.6% year-on-year growth, 3.1% beat)
- Adjusted EPS: $0 vs analyst estimates of -$0.08 (significant beat)
- Adjusted EBITDA: $189.2 million vs analyst estimates of $153.4 million (13.5% margin, 23.3% beat)
- Operating Margin: 6.6%, up from -4.6% in the same quarter last year
- Free Cash Flow was $88.9 million, up from -$79.2 million in the same quarter last year
- Market Capitalization: $1.27 billion
Company Overview
With a profile that was raised due to meme stock mania beginning in 2021, AMC Entertainment (NYSE: AMC) operates movie theaters primarily in the US and Europe.
Revenue Growth
A company’s long-term sales performance is one signal of its overall quality. Any business can put up a good quarter or two, but many enduring ones grow for years. Unfortunately, AMC Entertainment’s 5.7% annualized revenue growth over the last five years was sluggish. This fell short of our benchmark for the consumer discretionary sector and is a rough starting point for our analysis.
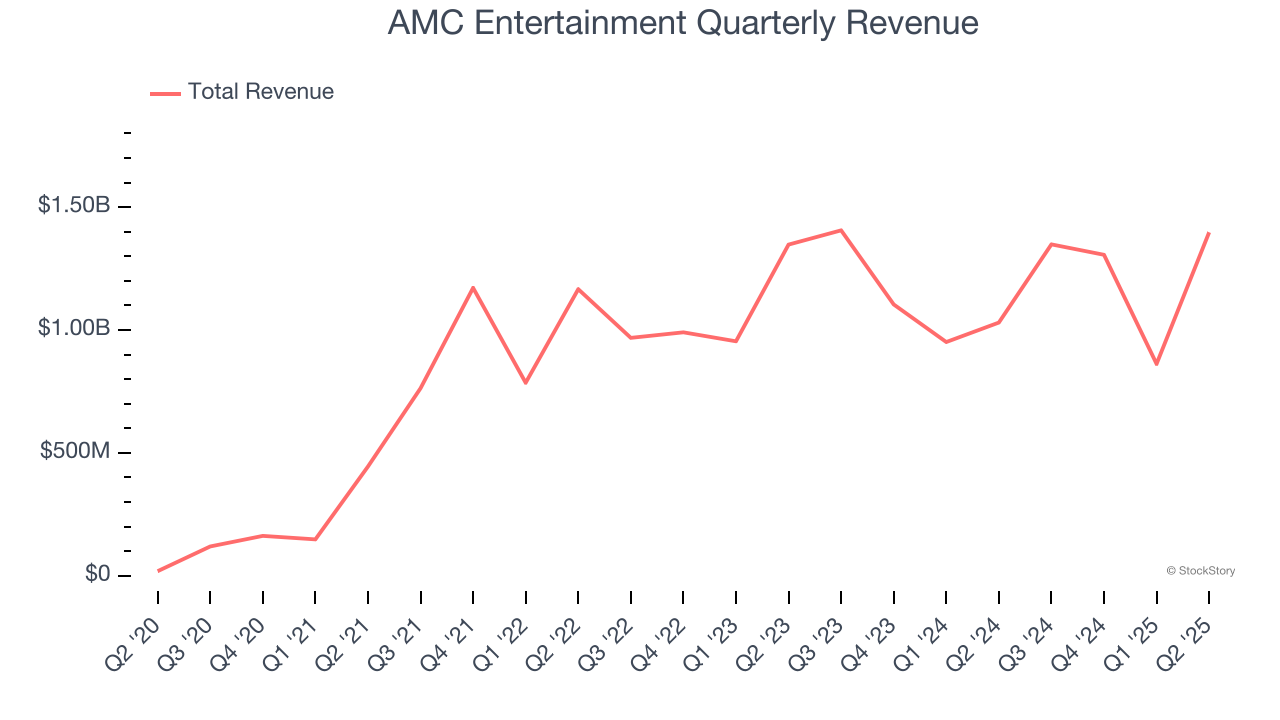
We at StockStory place the most emphasis on long-term growth, but within consumer discretionary, a stretched historical view may miss a company riding a successful new product or trend. AMC Entertainment’s annualized revenue growth of 7.4% over the last two years is above its five-year trend, but we were still disappointed by the results. Note that COVID hurt AMC Entertainment’s business in 2020 and part of 2021, and it bounced back in a big way thereafter. 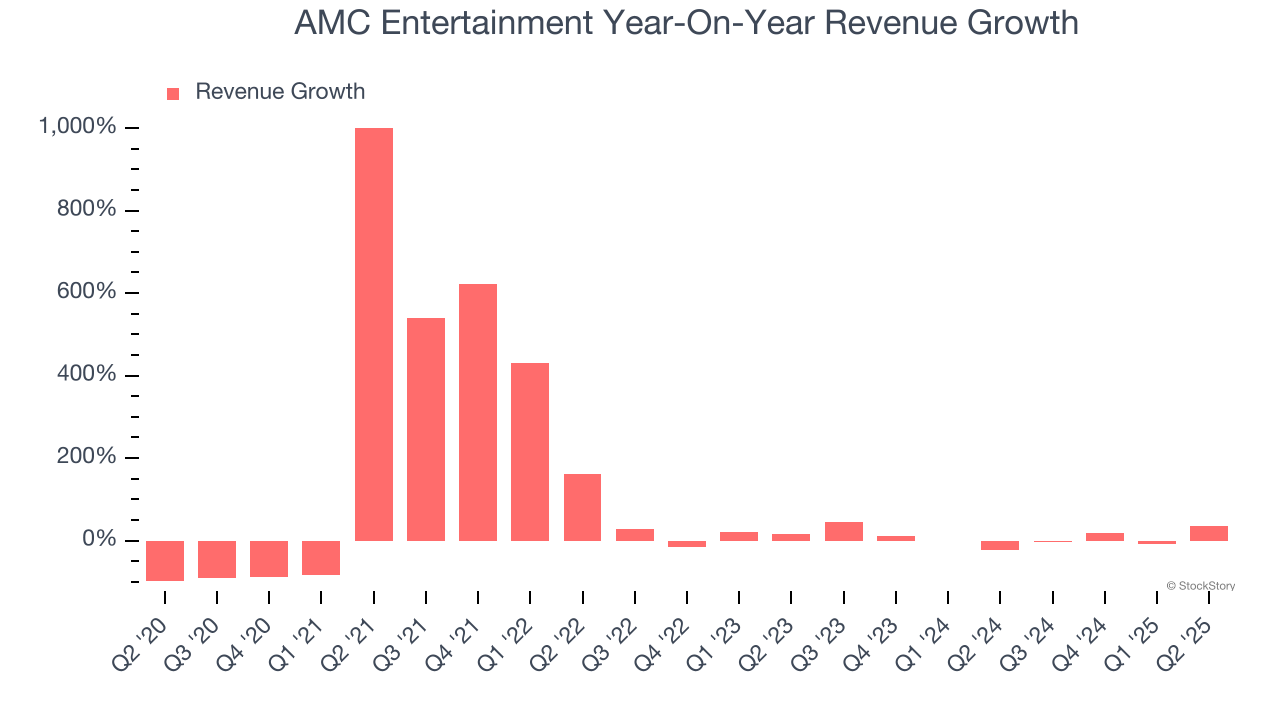
This quarter, AMC Entertainment reported wonderful year-on-year revenue growth of 35.6%, and its $1.40 billion of revenue exceeded Wall Street’s estimates by 3.1%.
Looking ahead, sell-side analysts expect revenue to grow 3.8% over the next 12 months, a deceleration versus the last two years. This projection is underwhelming and suggests its products and services will see some demand headwinds.
Today’s young investors won’t have read the timeless lessons in Gorilla Game: Picking Winners In High Technology because it was written more than 20 years ago when Microsoft and Apple were first establishing their supremacy. But if we apply the same principles, then enterprise software stocks leveraging their own generative AI capabilities may well be the Gorillas of the future. So, in that spirit, we are excited to present our Special Free Report on a profitable, fast-growing enterprise software stock that is already riding the automation wave and looking to catch the generative AI next.
Operating Margin
AMC Entertainment’s operating margin has risen over the last 12 months, but it still averaged negative 2% over the last two years. This is due to its large expense base and inefficient cost structure.
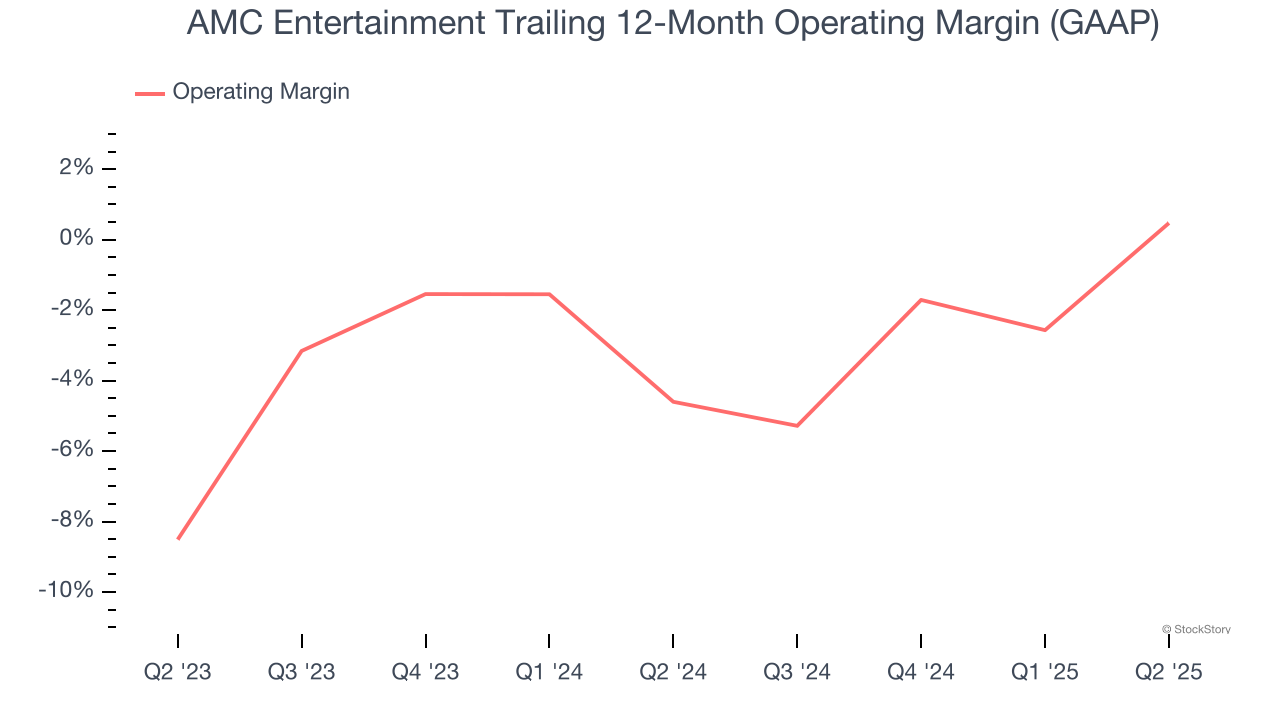
In Q2, AMC Entertainment generated an operating margin profit margin of 6.6%, up 11.2 percentage points year on year. This increase was a welcome development and shows it was more efficient.
Earnings Per Share
We track the long-term change in earnings per share (EPS) for the same reason as long-term revenue growth. Compared to revenue, however, EPS highlights whether a company’s growth is profitable.
Although AMC Entertainment’s full-year earnings are still negative, it reduced its losses and improved its EPS by 59.8% annually over the last five years. The next few quarters will be critical for assessing its long-term profitability.
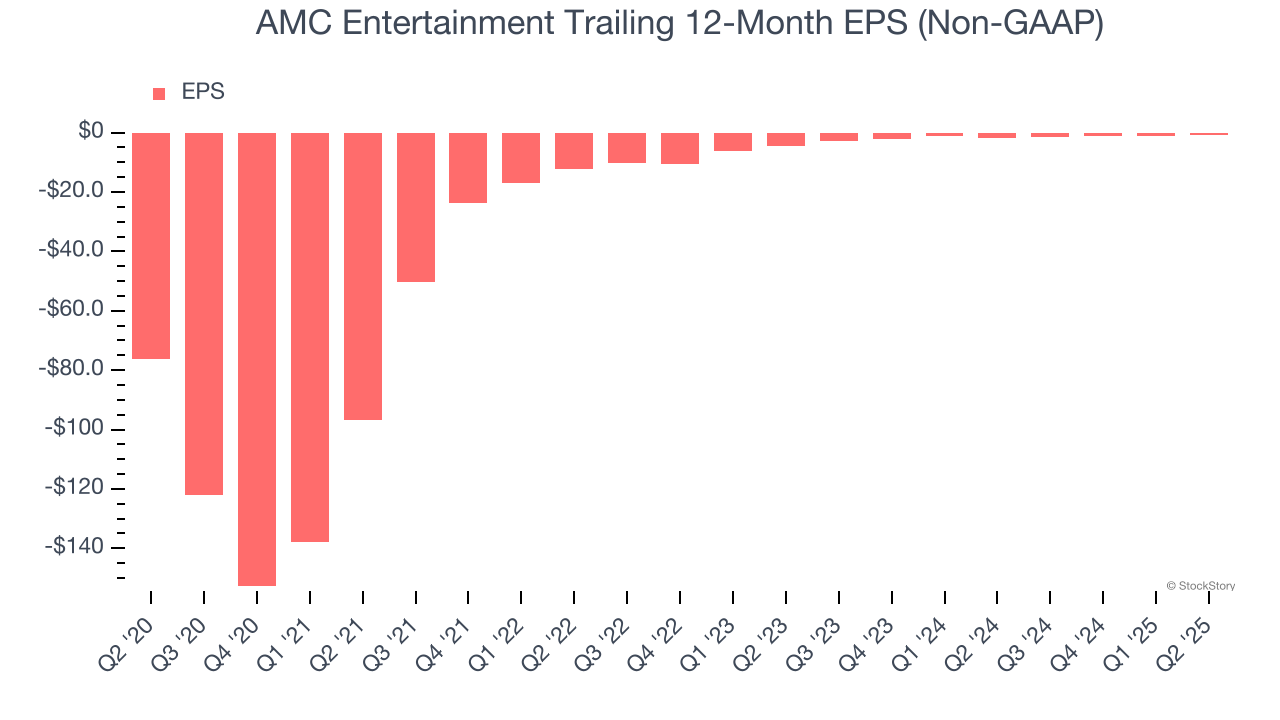
In Q2, AMC Entertainment reported adjusted EPS at $0, up from negative $0.43 in the same quarter last year. This print easily cleared analysts’ estimates, and shareholders should be content with the results. Over the next 12 months, Wall Street expects AMC Entertainment to improve its earnings losses. Analysts forecast its full-year EPS of negative $0.80 will advance to negative $0.51.
Key Takeaways from AMC Entertainment’s Q2 Results
We were impressed by how significantly AMC Entertainment blew past analysts’ EPS and EBITDA expectations this quarter. We were also glad its revenue outperformed Wall Street’s estimates. Zooming out, we think this was a solid print. The stock traded up 6% to $3.11 immediately after reporting.
Sure, AMC Entertainment had a solid quarter, but if we look at the bigger picture, is this stock a buy? What happened in the latest quarter matters, but not as much as longer-term business quality and valuation, when deciding whether to invest in this stock. We cover that in our actionable full research report which you can read here, it’s free.