Electricity storage and software provider Fluence (NASDAQ: FLNC) fell short of the market’s revenue expectations in Q2 CY2025, but sales rose 24.7% year on year to $602.5 million. The company’s full-year revenue guidance of $2.7 billion at the midpoint came in 1.1% below analysts’ estimates. Its GAAP profit of $0.01 per share was $0.03 above analysts’ consensus estimates.
Is now the time to buy Fluence Energy? Find out by accessing our full research report, it’s free.
Fluence Energy (FLNC) Q2 CY2025 Highlights:
- Revenue: $602.5 million vs analyst estimates of $763.4 million (24.7% year-on-year growth, 21.1% miss)
- EPS (GAAP): $0.01 vs analyst estimates of -$0.02 ($0.03 beat)
- Adjusted EBITDA: $27.36 million vs analyst estimates of $13.19 million (4.5% margin, significant beat)
- The company reconfirmed its revenue guidance for the full year of $2.7 billion at the midpoint
- EBITDA guidance for the full year is $10 million at the midpoint, in line with analyst expectations
- Operating Margin: 2.1%, up from 0.9% in the same quarter last year
- Free Cash Flow was -$161.2 million compared to -$27.05 million in the same quarter last year
- Backlog: $4.9 billion at quarter end, up 8.9% year on year
- Market Capitalization: $1.20 billion
Company Overview
Pioneering the use of lithium-ion batteries for grid storage, Fluence (NASDAQ: FLNC) helps store renewable energy sources with battery systems.
Revenue Growth
Reviewing a company’s long-term sales performance reveals insights into its quality. Any business can put up a good quarter or two, but the best consistently grow over the long haul. Luckily, Fluence Energy’s sales grew at an incredible 49% compounded annual growth rate over the last five years. Its growth beat the average industrials company and shows its offerings resonate with customers.
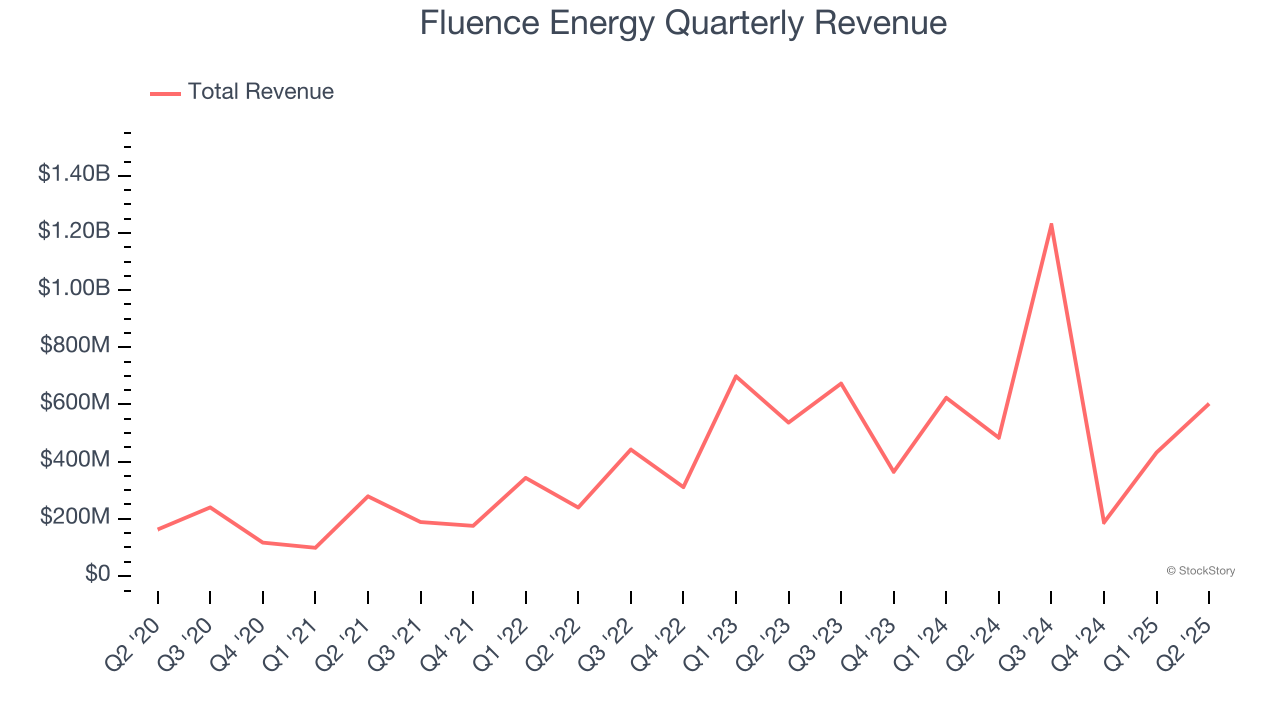
Long-term growth is the most important, but within industrials, a half-decade historical view may miss new industry trends or demand cycles. Fluence Energy’s annualized revenue growth of 11% over the last two years is below its five-year trend, but we still think the results suggest healthy demand. Fluence Energy recent performance stands out, especially when considering many similar Renewable Energy businesses faced declining sales because of cyclical headwinds. 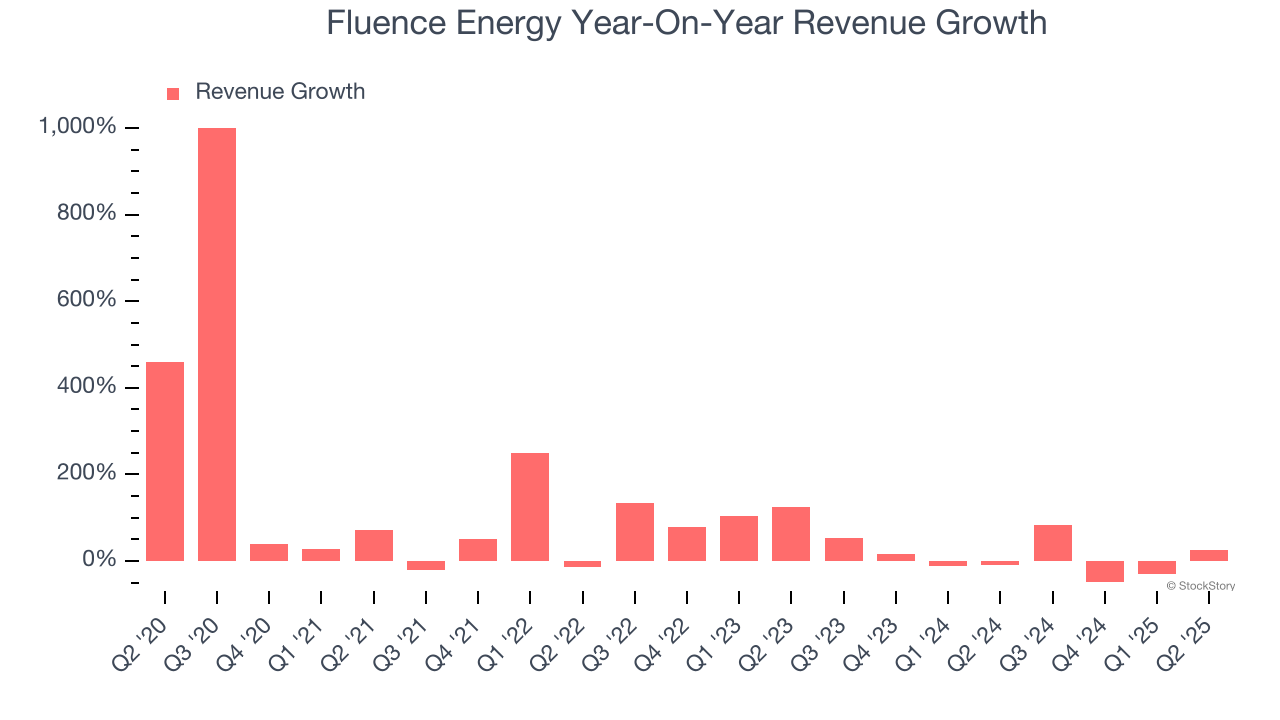
This quarter, Fluence Energy generated an excellent 24.7% year-on-year revenue growth rate, but its $602.5 million of revenue fell short of Wall Street’s high expectations.
Looking ahead, sell-side analysts expect revenue to grow 39% over the next 12 months, an improvement versus the last two years. This projection is eye-popping and implies its newer products and services will fuel better top-line performance.
Today’s young investors won’t have read the timeless lessons in Gorilla Game: Picking Winners In High Technology because it was written more than 20 years ago when Microsoft and Apple were first establishing their supremacy. But if we apply the same principles, then enterprise software stocks leveraging their own generative AI capabilities may well be the Gorillas of the future. So, in that spirit, we are excited to present our Special Free Report on a profitable, fast-growing enterprise software stock that is already riding the automation wave and looking to catch the generative AI next.
Operating Margin
Operating margin is one of the best measures of profitability because it tells us how much money a company takes home after procuring and manufacturing its products, marketing and selling those products, and most importantly, keeping them relevant through research and development.
Although Fluence Energy was profitable this quarter from an operational perspective, it’s generally struggled over a longer time period. Its expensive cost structure has contributed to an average operating margin of negative 7.5% over the last five years. Unprofitable industrials companies require extra attention because they could get caught swimming naked when the tide goes out. It’s hard to trust that the business can endure a full cycle.
On the plus side, Fluence Energy’s operating margin rose by 9.1 percentage points over the last five years, as its sales growth gave it operating leverage. Still, it will take much more for the company to show consistent profitability.
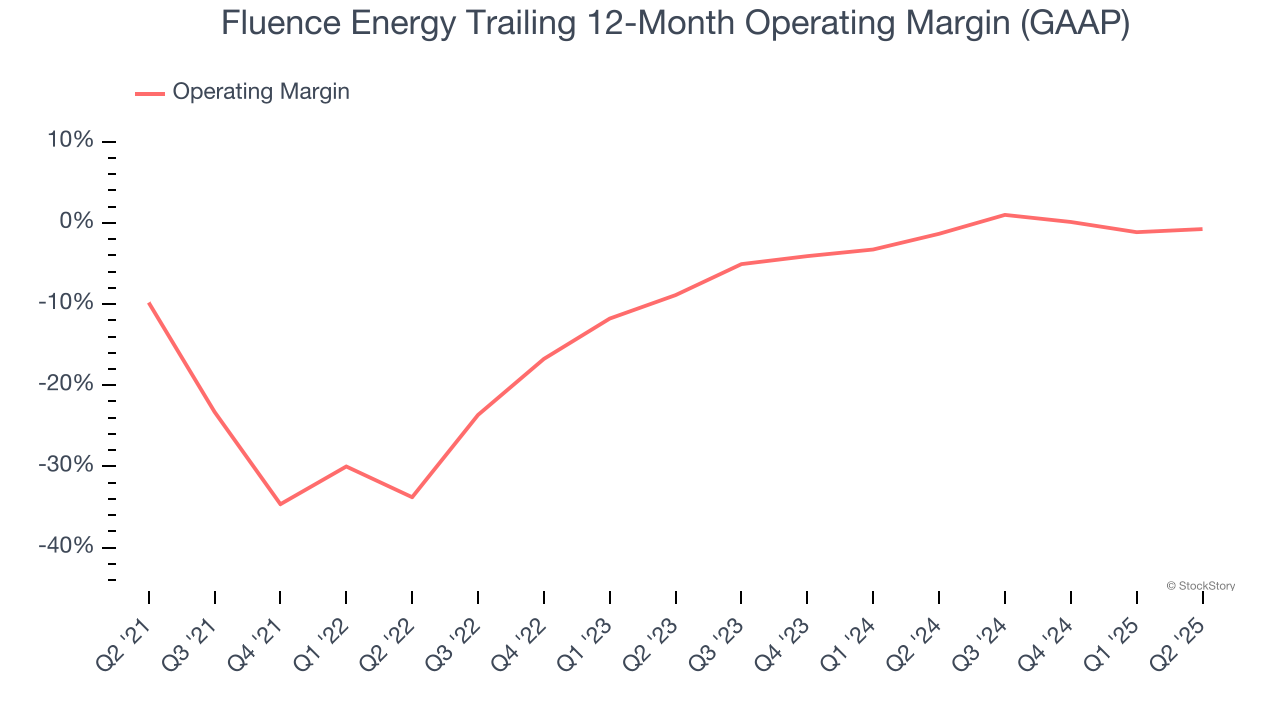
This quarter, Fluence Energy generated an operating margin profit margin of 2.1%, up 1.1 percentage points year on year. The increase was encouraging, and because its gross margin actually decreased, we can assume it was more efficient because its operating expenses like marketing, R&D, and administrative overhead grew slower than its revenue.
Earnings Per Share
Revenue trends explain a company’s historical growth, but the long-term change in earnings per share (EPS) points to the profitability of that growth – for example, a company could inflate its sales through excessive spending on advertising and promotions.
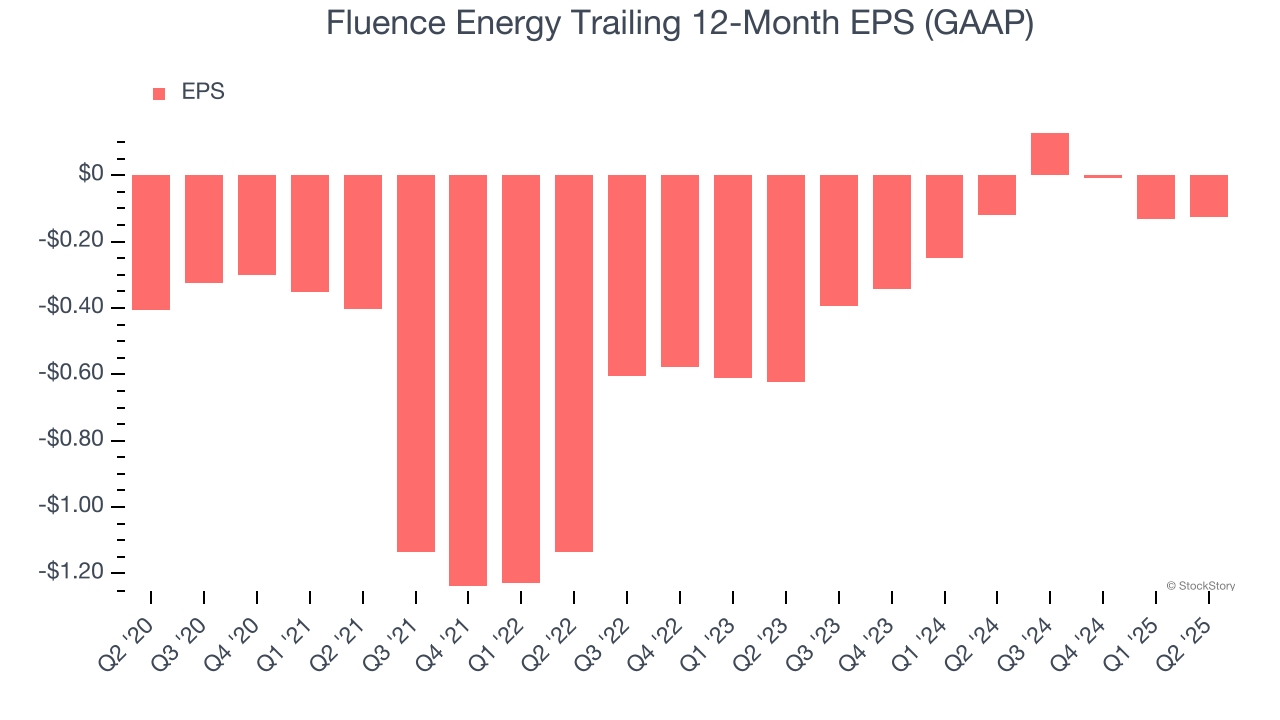
Although Fluence Energy’s full-year earnings are still negative, it reduced its losses and improved its EPS by 21.1% annually over the last five years. The next few quarters will be critical for assessing its long-term profitability. We hope to see an inflection point soon.
Like with revenue, we analyze EPS over a shorter period to see if we are missing a change in the business.
For Fluence Energy, its two-year annual EPS growth of 55.3% was higher than its five-year trend. We love it when earnings improve, but a caveat is that its EPS is still in the red.
In Q2, Fluence Energy reported EPS at $0.01, in line with the same quarter last year. This print easily cleared analysts’ estimates, and shareholders should be content with the results. Over the next 12 months, Wall Street is optimistic. Analysts forecast Fluence Energy’s full-year EPS of negative $0.12 will reach break even.
Key Takeaways from Fluence Energy’s Q2 Results
Fluence Energy's revenue missed significantly and its full-year revenue guidance also fell slightly short of Wall Street’s estimates. A bright spot was that EBITDA beat, although full-year EBITDA guidance was just in line. Zooming out, we think this was a bad quarter. Shares traded down 14.4% to $7.92 immediately after reporting.
Is Fluence Energy an attractive investment opportunity at the current price? If you’re making that decision, you should consider the bigger picture of valuation, business qualities, as well as the latest earnings. We cover that in our actionable full research report which you can read here, it’s free.