
Over the past six months, Community Bank’s stock price fell to $58.84. Shareholders have lost 9.8% of their capital, which is disappointing considering the S&P 500 has climbed by 5.4%. This was partly driven by its softer quarterly results and might have investors contemplating their next move.
Following the pullback, is now an opportune time to buy CBU? Find out in our full research report, it’s free.
Why Does Community Bank Spark Debate?
Tracing its roots back to 1866 in upstate New York, Community Financial System (NYSE: CBU) is a financial holding company that provides banking, employee benefits, wealth management, and insurance services to retail, commercial, and municipal customers.
Two Positive Attributes:
1. Long-Term Revenue Growth Shows Momentum
Two primary revenue streams drive bank earnings. While net interest income, which is earned by charging higher rates on loans than paid on deposits, forms the foundation, fee-based services across banking, credit, wealth management, and trading operations provide additional income.
Luckily, Community Bank’s revenue grew at a decent 5.7% compounded annual growth rate over the last five years. Its growth was slightly above the average banking company and shows its offerings resonate with customers. 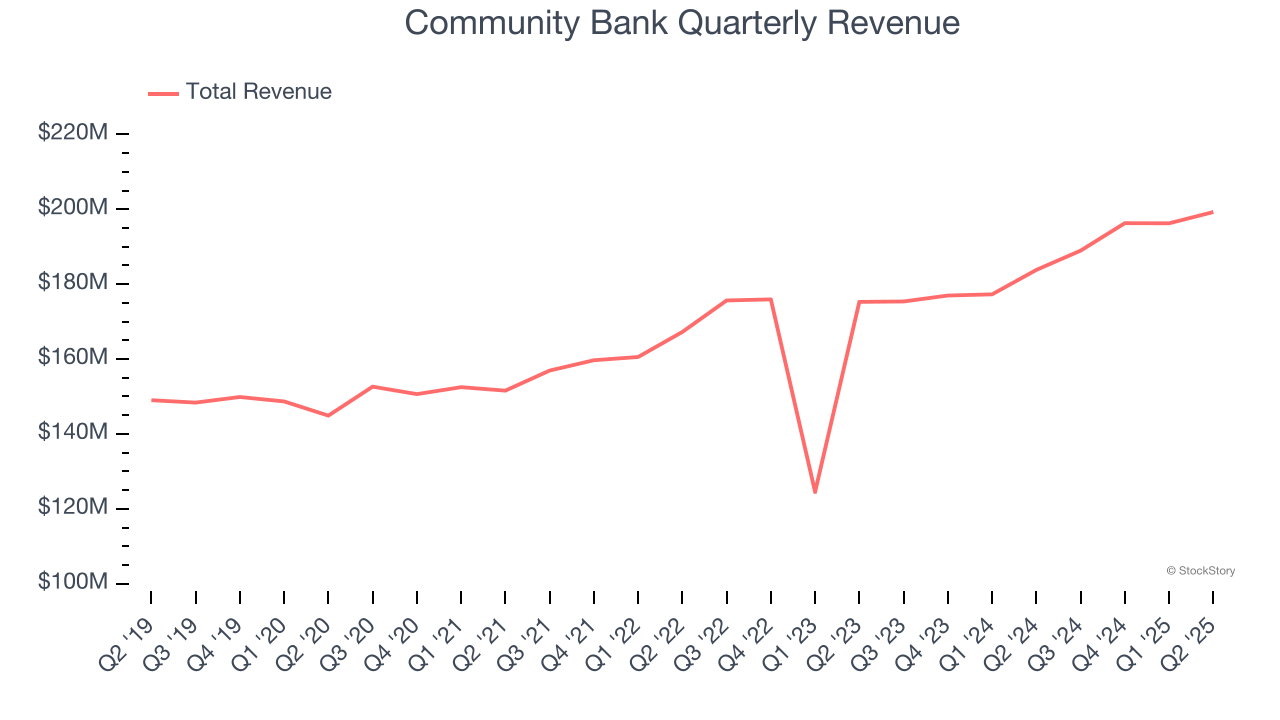
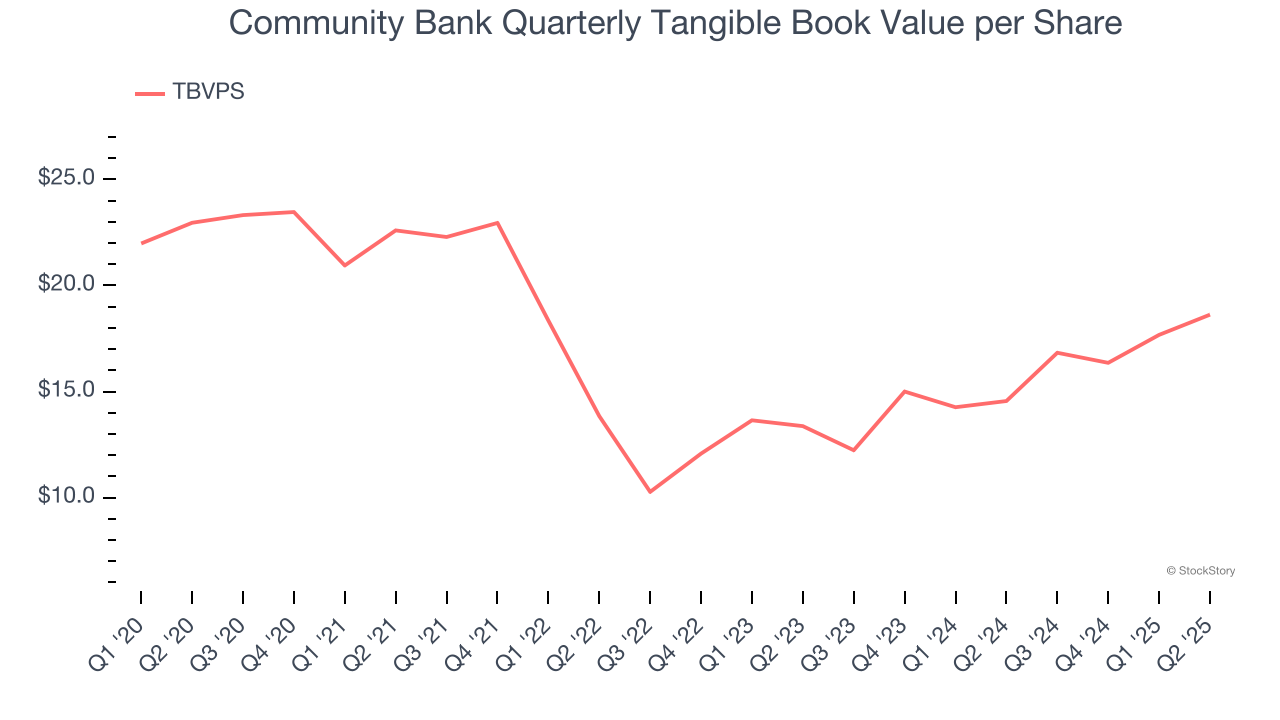
2. Projected TBVPS Growth Is Remarkable
Tangible book value per share (TBVPS) growth comes from a bank’s ability to profitably lend while maintaining prudent risk management and efficient operations.
Over the next 12 months, Consensus estimates call for Community Bank’s TBVPS to grow by 18.6% to $22.10, elite growth rate.
One Reason to be Careful:
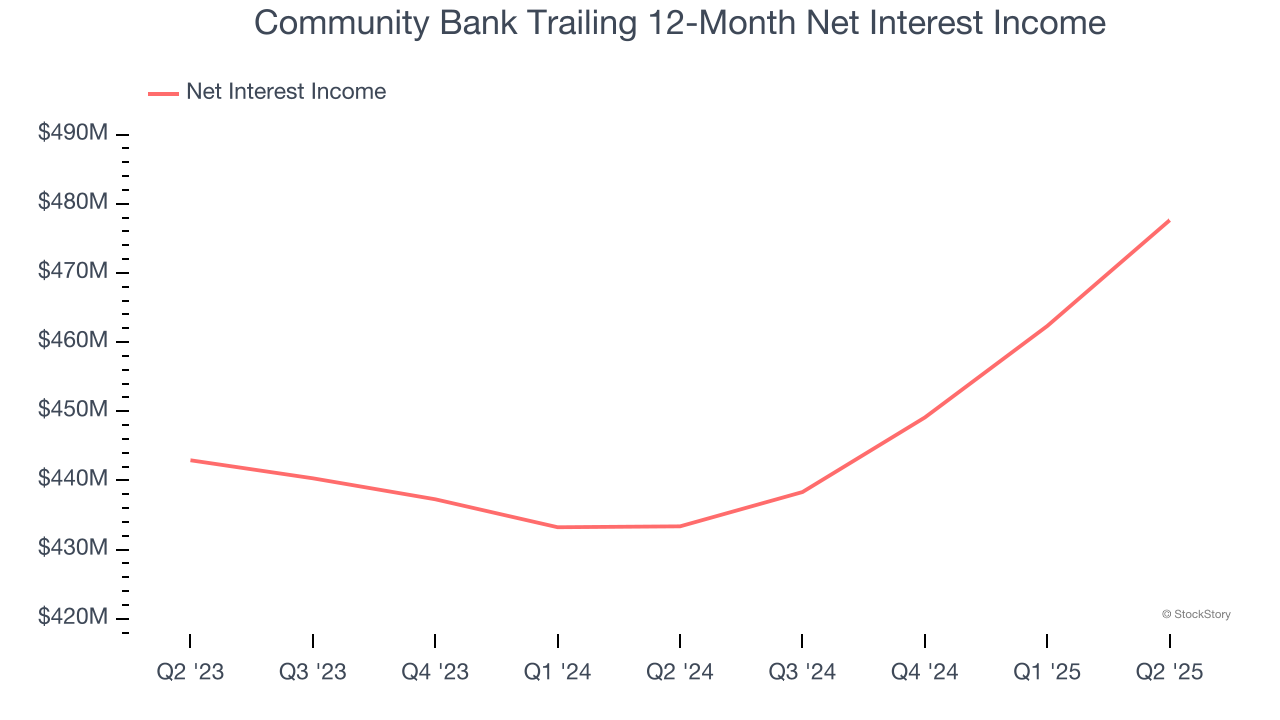
Net Interest Income Points to Soft Demand
Net interest income commands greater market attention due to its reliability and consistency, whereas one-time fees are often seen as lower-quality revenue that lacks the same dependable characteristics.
Community Bank’s net interest income has grown at a 6.1% annualized rate over the last five years, slightly worse than the broader banking industry and in line with its total revenue. Its growth was driven by both an increase in its outstanding loans and net interest margin, which represents how much a bank earns in relation to its outstanding loan book.
Final Judgment
Community Bank’s merits more than compensate for its flaws. After the recent drawdown, the stock trades at 1.6× forward P/B (or $58.84 per share). Is now a good time to buy? See for yourself in our full research report, it’s free.
Stocks We Like Even More Than Community Bank
Trump’s April 2025 tariff bombshell triggered a massive market selloff, but stocks have since staged an impressive recovery, leaving those who panic sold on the sidelines.
Take advantage of the rebound by checking out our Top 5 Growth Stocks for this month. This is a curated list of our High Quality stocks that have generated a market-beating return of 183% over the last five years (as of March 31st 2025).
Stocks that made our list in 2020 include now familiar names such as Nvidia (+1,545% between March 2020 and March 2025) as well as under-the-radar businesses like the once-micro-cap company Kadant (+351% five-year return). Find your next big winner with StockStory today.
StockStory is growing and hiring equity analyst and marketing roles. Are you a 0 to 1 builder passionate about the markets and AI? See the open roles here.