
Specialty insurance provider Fidelis Insurance (NYSE: FIHL) fell short of the market’s revenue expectations in Q2 CY2025, but sales rose 9.1% year on year to $589.3 million. Its non-GAAP profit of $0.12 per share was significantly above analysts’ consensus estimates.
Is now the time to buy Fidelis Insurance? Find out by accessing our full research report, it’s free.
Fidelis Insurance (FIHL) Q2 CY2025 Highlights:
- Net Premiums Earned: $538 million vs analyst estimates of $611.5 million (7.4% year-on-year growth, 12% miss)
- Revenue: $589.3 million vs analyst estimates of $646.7 million (9.1% year-on-year growth, 8.9% miss)
- Combined Ratio: 104% vs analyst estimates of 110% (670 basis point beat)
- Adjusted EPS: $0.12 vs analyst estimates of -$0.33 (significant beat)
- Book Value per Share: $22.04 vs analyst estimates of $21.68 (1.1% year-on-year growth, 1.7% beat)
- Market Capitalization: $1.85 billion
Dan Burrows, Group Chief Executive Officer of Fidelis Insurance Group, commented: “We have continued to successfully execute on our strategy of balancing the pursuit of profitable underwriting opportunities with returning meaningful capital to shareholders."
Company Overview
Founded in Bermuda in 2014 and designed to adapt nimbly to evolving market conditions, Fidelis Insurance (NYSE: FIHL) is a global specialty insurer and reinsurer that provides customized coverage across property, specialty, and bespoke risk solutions.
Revenue Growth
Insurance companies earn revenue from three primary sources:
- The core insurance business itself, often called underwriting and represented in the income statement as premiums
- Income from investing the “float” (premiums collected upfront not yet paid out as claims) in assets such as fixed-income assets and equities
- Fees from various sources such as policy administration, annuities, or other value-added services
Fidelis Insurance’s annualized revenue growth rate of 21.8% over the last two years was incredible for an insurance business.
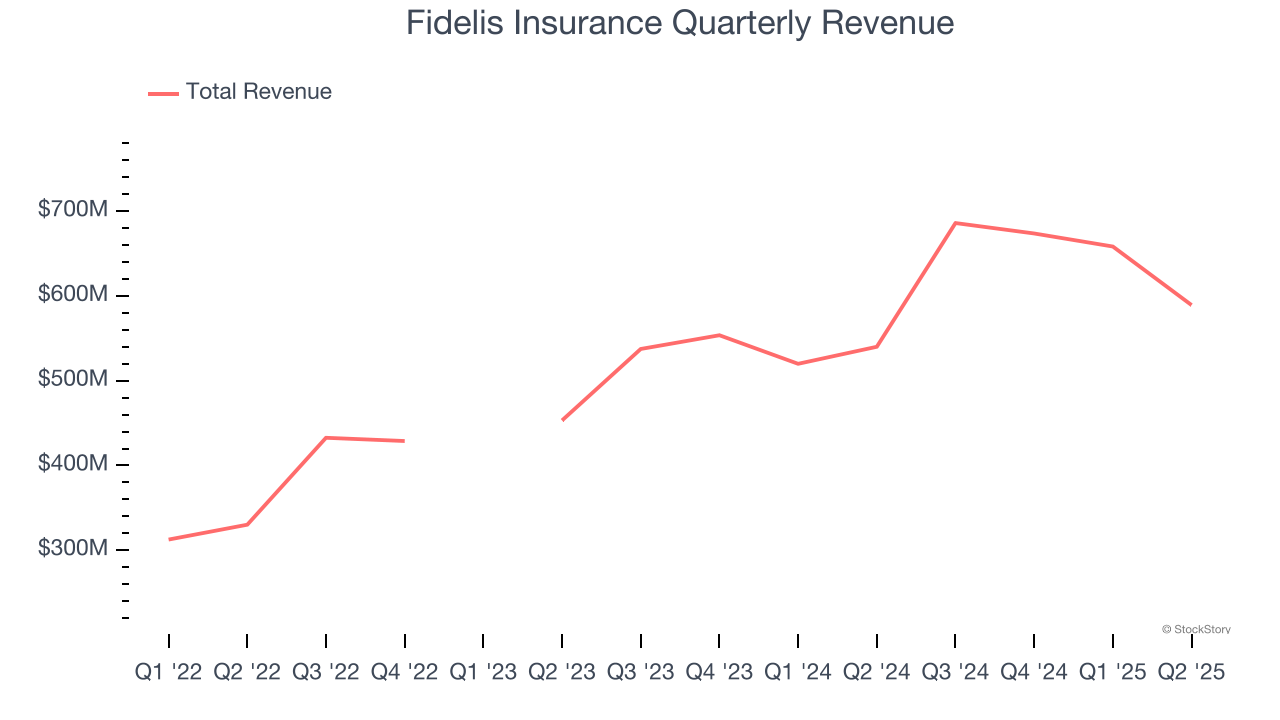 Note: Quarters not shown were determined to be outliers, impacted by outsized investment gains/losses that are not indicative of the recurring fundamentals of the business.
This quarter, Fidelis Insurance’s revenue grew by 9.1% year on year to $589.3 million, missing Wall Street’s estimates.
Net premiums earned made up 76.8% of the company’s total revenue during the last four years, meaning insurance operations are Fidelis Insurance’s largest source of revenue.
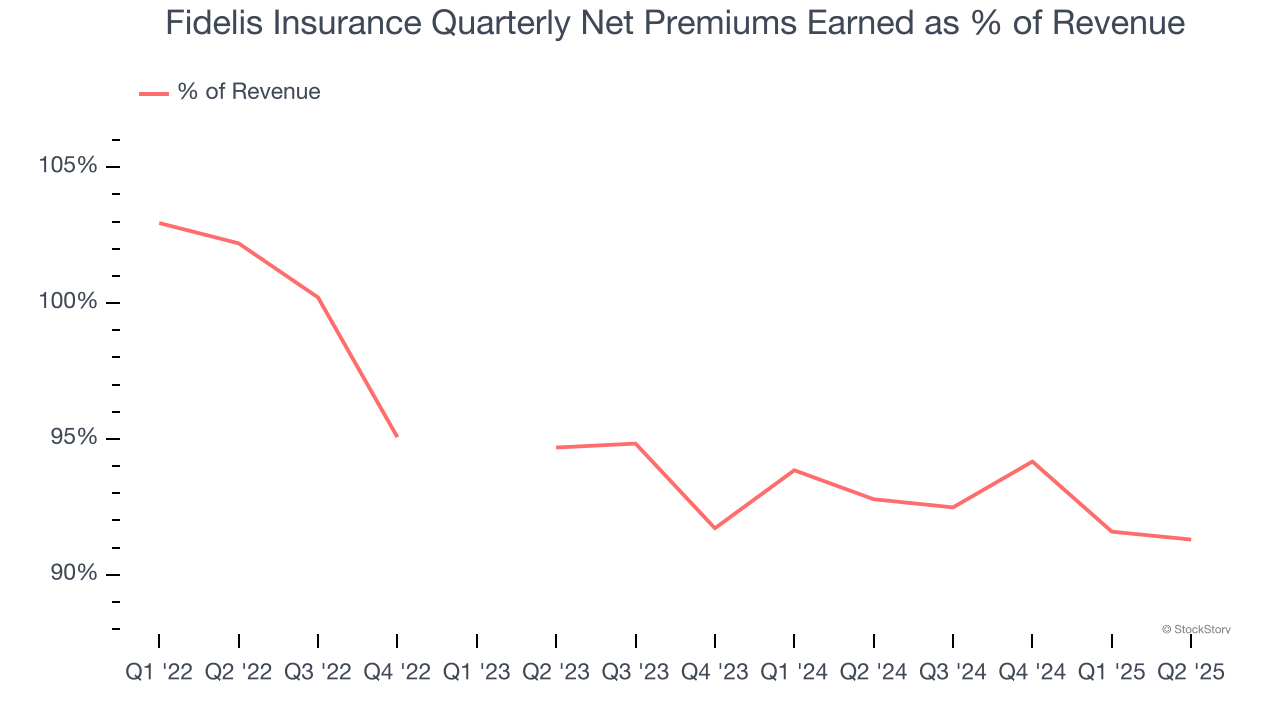 Note: Quarters not shown were determined to be outliers, impacted by outsized investment gains/losses that are not indicative of the recurring fundamentals of the business.
Markets consistently prioritize net premiums earned growth over investment and fee income, recognizing its superior quality as a core indicator of the company’s underwriting success and market penetration.
Software is eating the world and there is virtually no industry left that has been untouched by it. That drives increasing demand for tools helping software developers do their jobs, whether it be monitoring critical cloud infrastructure, integrating audio and video functionality, or ensuring smooth content streaming. Click here to access a free report on our 3 favorite stocks to play this generational megatrend.
Book Value Per Share (BVPS)
Insurance companies are balance sheet businesses, collecting premiums upfront and paying out claims over time. The float–premiums collected but not yet paid out–are invested, creating an asset base supported by a liability structure. Book value per share (BVPS) captures this dynamic by measuring these assets (investment portfolio, cash, reinsurance recoverables) less liabilities (claim reserves, debt, future policy benefits). BVPS is essentially the residual value for shareholders.
We therefore consider BVPS very important to track for insurers and a metric that sheds light on business quality because it reflects long-term capital growth and is harder to manipulate than more commonly-used metrics like EPS.
Disappointingly for investors, Fidelis Insurance’s BVPS grew at a mediocre 11% annual clip over the last two years.
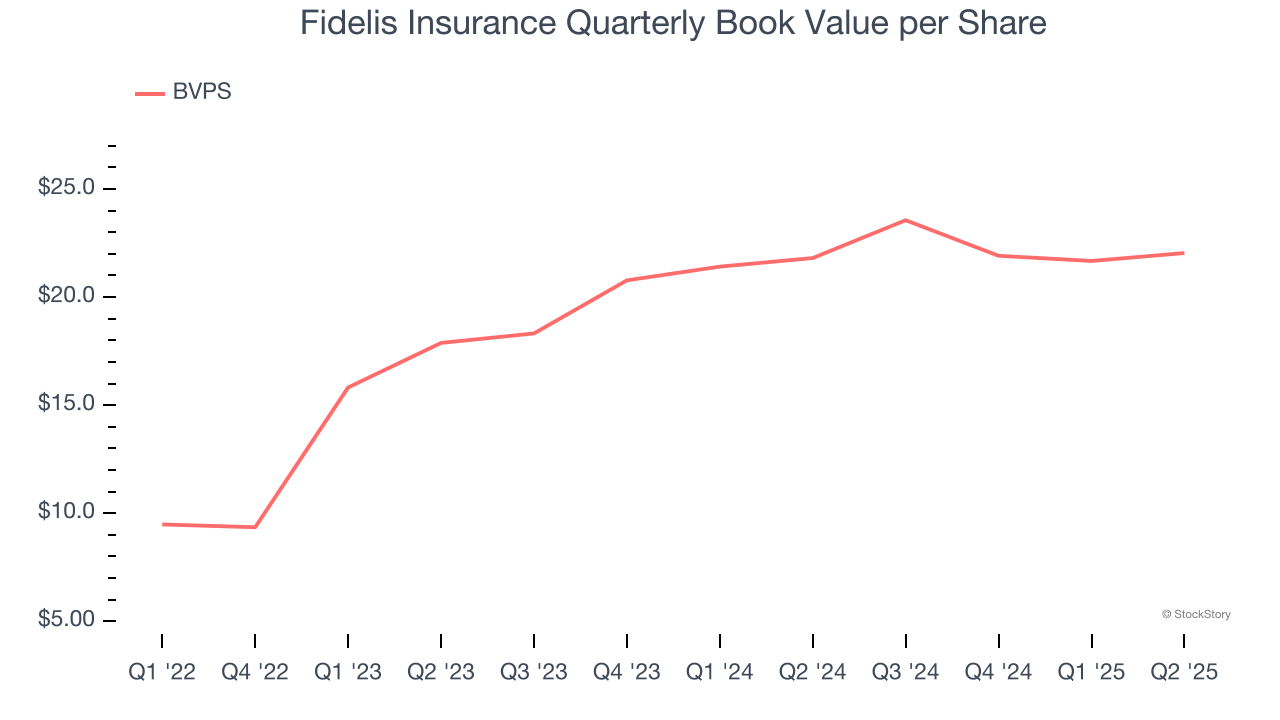
Over the next 12 months, Consensus estimates call for Fidelis Insurance’s BVPS to grow by 21.4% to $21.68, elite growth rate.
Key Takeaways from Fidelis Insurance’s Q2 Results
It was good to see Fidelis Insurance beat analysts’ EPS and combined ratio expectations this quarter. We were also happy its book value per share outperformed Wall Street’s estimates. On the other hand, its revenue and net premiums earned fell short. Overall, this print was mixed but still had some key positives. The stock remained flat at $17.51 immediately after reporting.
Is Fidelis Insurance an attractive investment opportunity at the current price? When making that decision, it’s important to consider its valuation, business qualities, as well as what has happened in the latest quarter. We cover that in our actionable full research report which you can read here, it’s free.


