
Auto parts and accessories retailer Advance Auto Parts (NYSE: AAP) reported Q2 CY2025 results exceeding the market’s revenue expectations, but sales fell by 7.7% year on year to $2.01 billion. The company expects the full year’s revenue to be around $8.5 billion, close to analysts’ estimates. Its non-GAAP profit of $0.69 per share was 18.3% above analysts’ consensus estimates.
Is now the time to buy Advance Auto Parts? Find out by accessing our full research report, it’s free.
Advance Auto Parts (AAP) Q2 CY2025 Highlights:
- Revenue: $2.01 billion vs analyst estimates of $1.99 billion (7.7% year-on-year decline, 1% beat)
- Adjusted EPS: $0.69 vs analyst estimates of $0.58 (18.3% beat)
- Adjusted EBITDA: $68 million vs analyst estimates of $132.3 million (3.4% margin, 48.6% miss)
- The company reconfirmed its revenue guidance for the full year of $8.5 billion at the midpoint
- Management lowered its full-year Adjusted EPS guidance to $1.70 at the midpoint, a 15% decrease
- Operating Margin: 1.1%, down from 2.4% in the same quarter last year
- Free Cash Flow was -$3 million, down from $44.37 million in the same quarter last year
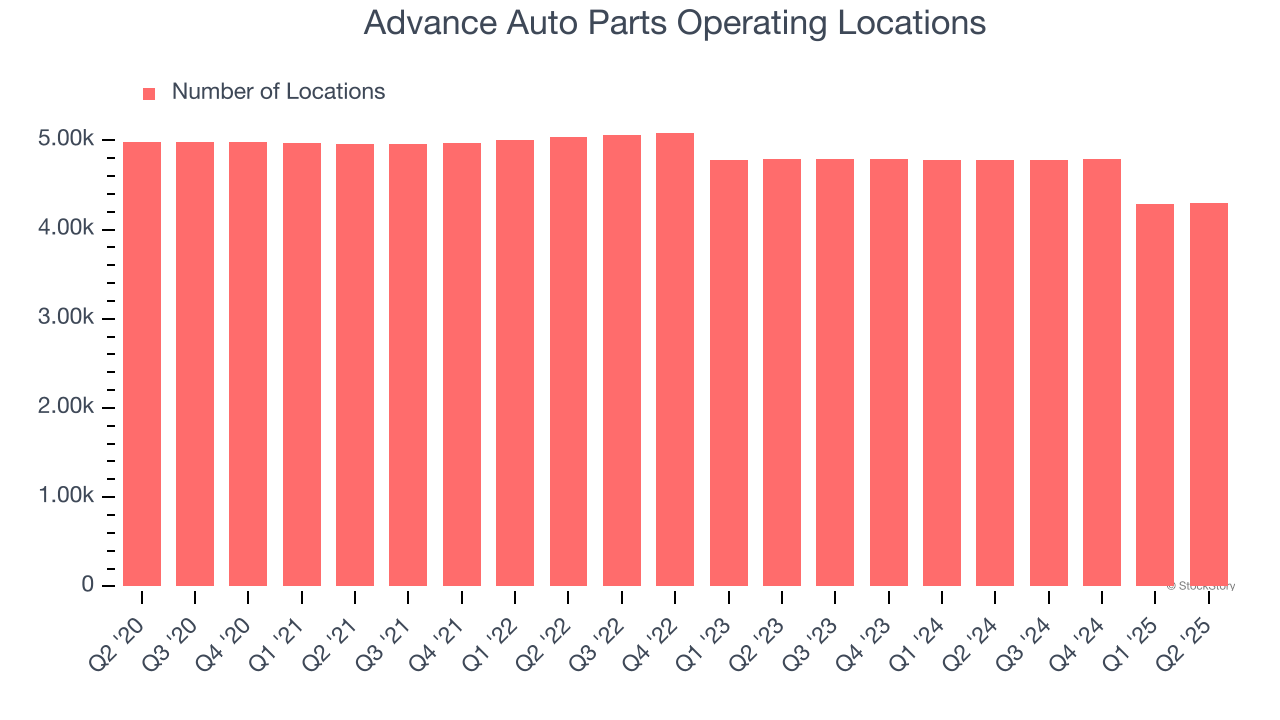
- Locations: 4,292 at quarter end, down from 4,776 in the same quarter last year
- Same-Store Sales were flat year on year, in line with the same quarter last year
- Market Capitalization: $3.70 billion
"The Advance team delivered solid second-quarter results, with both sales and operating margin at the upper end of our expectations. I want to thank the team for their dedication and hard work throughout the quarter," said Shane O'Kelly, president and chief executive officer.
Company Overview
Founded in Virginia in 1932, Advance Auto Parts (NYSE: AAP) is an auto parts and accessories retailer that sells everything from carburetors to motor oil to car floor mats.
Revenue Growth
A company’s long-term sales performance is one signal of its overall quality. Any business can have short-term success, but a top-tier one grows for years.
With $8.74 billion in revenue over the past 12 months, Advance Auto Parts is a mid-sized retailer, which sometimes brings disadvantages compared to larger competitors benefiting from better economies of scale.
As you can see below, Advance Auto Parts struggled to generate demand over the last six years (we compare to 2019 to normalize for COVID-19 impacts). Its sales dropped by 1.7% annually as it closed stores.
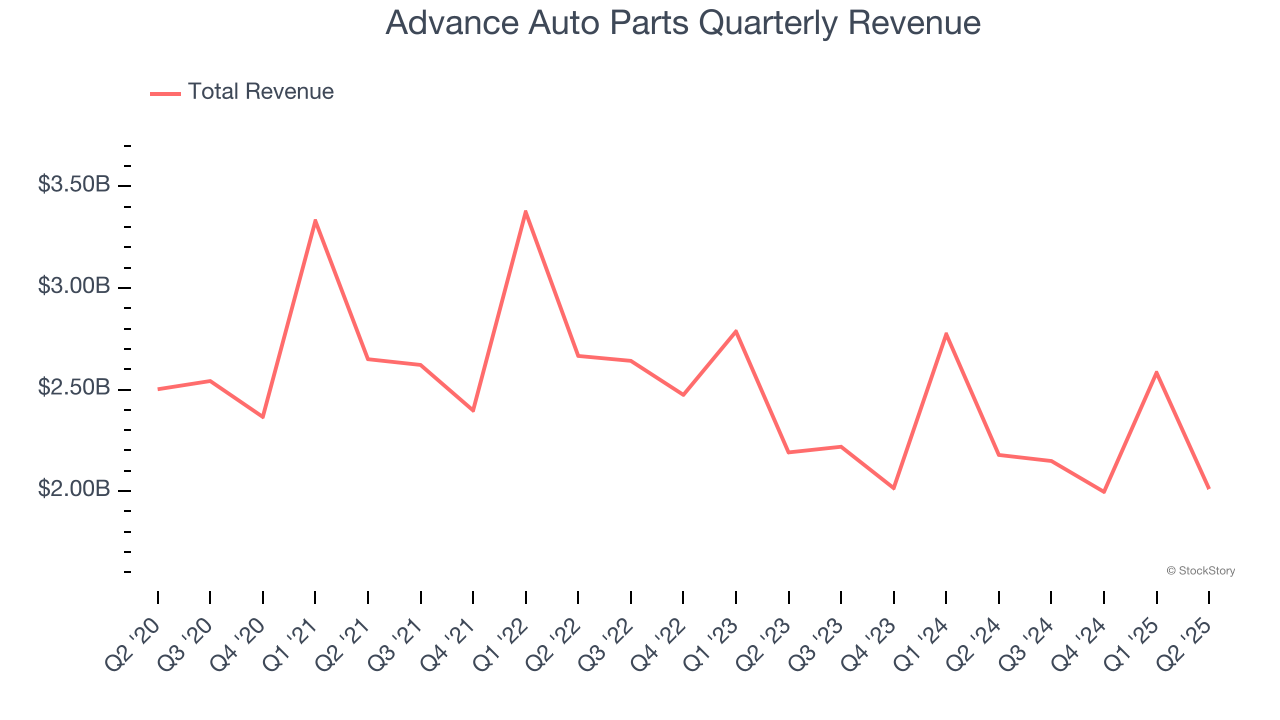
This quarter, Advance Auto Parts’s revenue fell by 7.7% year on year to $2.01 billion but beat Wall Street’s estimates by 1%.
Looking ahead, sell-side analysts expect revenue to decline by 1.2% over the next 12 months, similar to its six-year rate. This projection doesn't excite us and implies its newer products will not lead to better top-line performance yet.
Here at StockStory, we certainly understand the potential of thematic investing. Diverse winners from Microsoft (MSFT) to Alphabet (GOOG), Coca-Cola (KO) to Monster Beverage (MNST) could all have been identified as promising growth stories with a megatrend driving the growth. So, in that spirit, we’ve identified a relatively under-the-radar profitable growth stock benefiting from the rise of AI, available to you FREE via this link.
Store Performance
Number of Stores
A retailer’s store count influences how much it can sell and how quickly revenue can grow.
Advance Auto Parts listed 4,292 locations in the latest quarter and has generally closed its stores over the last two years, averaging 4% annual declines.
When a retailer shutters stores, it usually means that brick-and-mortar demand is less than supply, and it is responding by closing underperforming locations to improve profitability.
Same-Store Sales
A company's store base only paints one part of the picture. When demand is high, it makes sense to open more. But when demand is low, it’s prudent to close some locations and use the money in other ways. Same-store sales provides a deeper understanding of this issue because it measures organic growth at brick-and-mortar shops for at least a year.
Advance Auto Parts’s demand within its existing locations has barely increased over the last two years as its same-store sales were flat. This performance isn’t ideal, and Advance Auto Parts is attempting to boost same-store sales by closing stores (fewer locations sometimes lead to higher same-store sales).
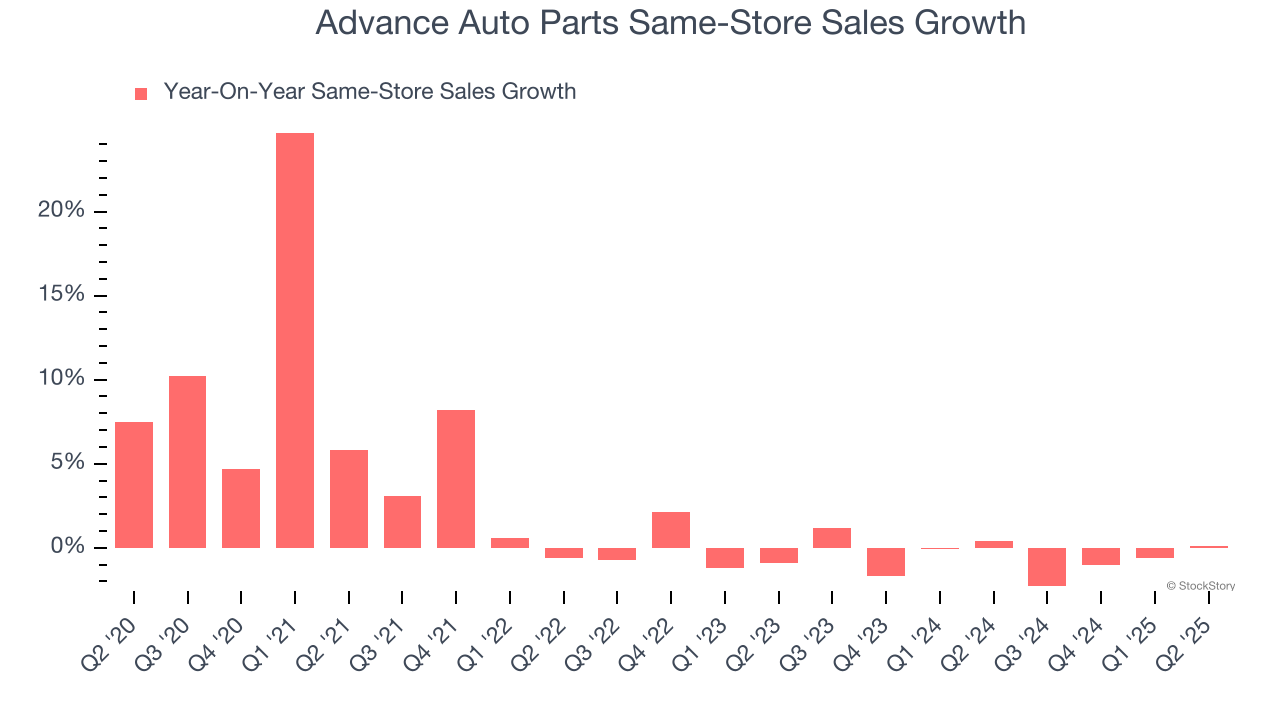
In the latest quarter, Advance Auto Parts’s year on year same-store sales were flat. This performance was more or less in line with its historical levels.
Key Takeaways from Advance Auto Parts’s Q2 Results
It was good to see Advance Auto Parts beat analysts’ EPS expectations this quarter. We were also happy its revenue narrowly outperformed Wall Street’s estimates. On the other hand, its full-year EPS guidance missed and its EBITDA fell short of Wall Street’s estimates. Overall, this was a softer quarter. The stock remained flat at $61.30 immediately following the results.
Advance Auto Parts may have had a tough quarter, but does that actually create an opportunity to invest right now? When making that decision, it’s important to consider its valuation, business qualities, as well as what has happened in the latest quarter. We cover that in our actionable full research report which you can read here, it’s free.