
Department store chain Dillard’s (NYSE: DDS) reported Q2 CY2025 results exceeding the market’s revenue expectations, with sales up 1.4% year on year to $1.54 billion. Its GAAP profit of $4.66 per share was 16.6% above analysts’ consensus estimates.
Is now the time to buy Dillard's? Find out by accessing our full research report, it’s free.
Dillard's (DDS) Q2 CY2025 Highlights:
- Revenue: $1.54 billion vs analyst estimates of $1.50 billion (1.4% year-on-year growth, 2.6% beat)
- EPS (GAAP): $4.66 vs analyst estimates of $4.00 (16.6% beat)
- Adjusted EBITDA: $187.2 million vs analyst estimates of $128.6 million (12.2% margin, 45.6% beat)
- Operating Margin: 9.3%, up from 6.6% in the same quarter last year
- Free Cash Flow was $60.12 million, up from -$94.33 million in the same quarter last year
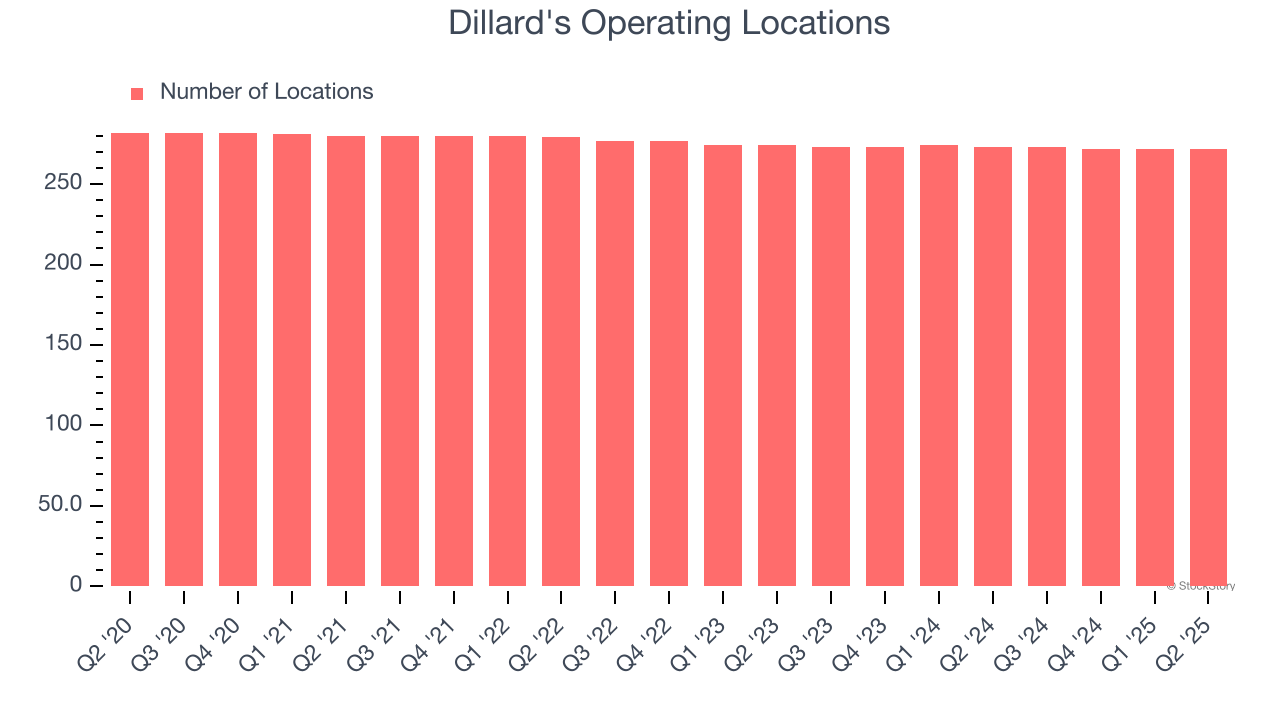
- Locations: 272 at quarter end, down from 273 in the same quarter last year
- Same-Store Sales rose 1% year on year (-5% in the same quarter last year)
- Market Capitalization: $7.77 billion
Dillard’s Chief Executive Officer William T. Dillard, II commented on the quarter, “We were happy to achieve a sales increase for the first time in a while and encouraged by strengthening sales trends in July. In an operating environment that changes daily, we focused on controlling inventory, ending up 2% compared to 6% at the end of first quarter.”
Company Overview
With stores located largely in the Southern and Western US, Dillard’s (NYSE: DDS) is a department store chain that sells clothing, cosmetics, accessories, and home goods.
Revenue Growth
A company’s long-term sales performance is one signal of its overall quality. Any business can experience short-term success, but top-performing ones enjoy sustained growth for years.
With $6.59 billion in revenue over the past 12 months, Dillard's is a mid-sized retailer, which sometimes brings disadvantages compared to larger competitors benefiting from better economies of scale.
As you can see below, Dillard's struggled to increase demand as its $6.59 billion of sales for the trailing 12 months was close to its revenue six years ago (we compare to 2019 to normalize for COVID-19 impacts). This was mainly because it didn’t open many new stores and observed lower sales at existing, established locations.
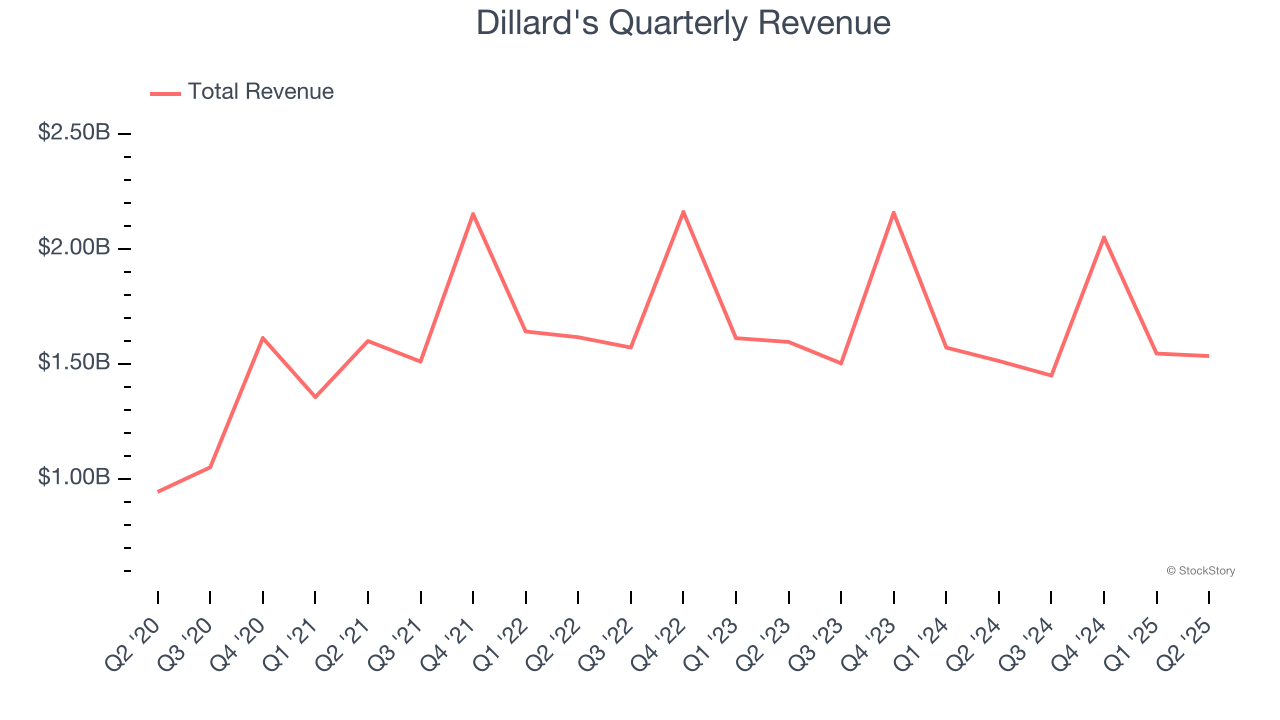
This quarter, Dillard's reported modest year-on-year revenue growth of 1.4% but beat Wall Street’s estimates by 2.6%.
Looking ahead, sell-side analysts expect revenue to decline by 3% over the next 12 months, a deceleration versus the last six years. This projection is underwhelming and implies its products will face some demand challenges.
Software is eating the world and there is virtually no industry left that has been untouched by it. That drives increasing demand for tools helping software developers do their jobs, whether it be monitoring critical cloud infrastructure, integrating audio and video functionality, or ensuring smooth content streaming. Click here to access a free report on our 3 favorite stocks to play this generational megatrend.
Store Performance
Number of Stores
A retailer’s store count often determines how much revenue it can generate.
Dillard's listed 272 locations in the latest quarter and has kept its store count flat over the last two years while other consumer retail businesses have opted for growth.
When a retailer keeps its store footprint steady, it usually means demand is stable and it’s focusing on operational efficiency to increase profitability.
Same-Store Sales
A company's store base only paints one part of the picture. When demand is high, it makes sense to open more. But when demand is low, it’s prudent to close some locations and use the money in other ways. Same-store sales is an industry measure of whether revenue is growing at those existing stores and is driven by customer visits (often called traffic) and the average spending per customer (ticket).
Dillard’s demand has been shrinking over the last two years as its same-store sales have averaged 2.9% annual declines. This performance isn’t ideal, and we’d be concerned if Dillard's starts opening new stores to artificially boost revenue growth.
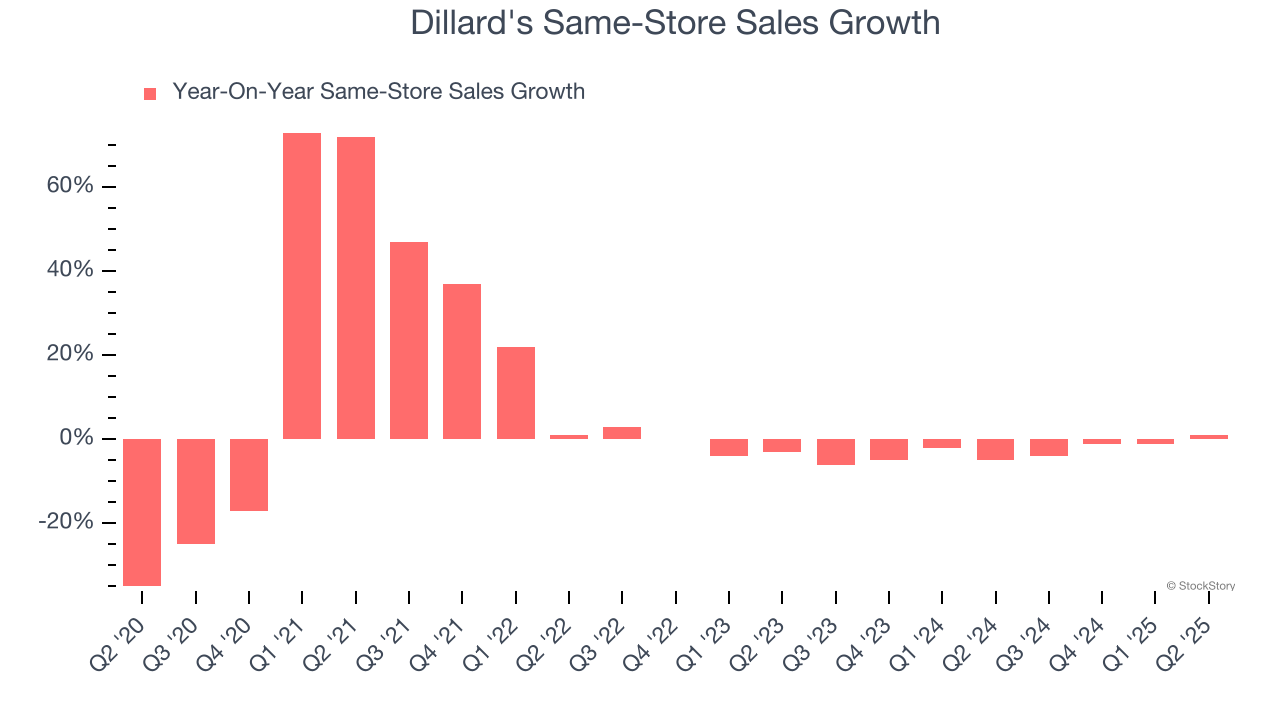
In the latest quarter, Dillard’s same-store sales rose 1% year on year. This growth was a well-appreciated turnaround from its historical levels, showing the business is regaining momentum.
Key Takeaways from Dillard’s Q2 Results
We were impressed by how significantly Dillard's blew past analysts’ EBITDA expectations this quarter. We were also glad its revenue outperformed Wall Street’s estimates. Zooming out, we think this quarter featured some important positives. The stock remained flat at $498.50 immediately after reporting.
Dillard's put up rock-solid earnings, but one quarter doesn’t necessarily make the stock a buy. Let’s see if this is a good investment. The latest quarter does matter, but not nearly as much as longer-term fundamentals and valuation, when deciding if the stock is a buy. We cover that in our actionable full research report which you can read here, it’s free.