Luxury fashion conglomerate Tapestry (NYSE: TPR) reported revenue ahead of Wall Street’s expectations in Q2 CY2025, with sales up 8.3% year on year to $1.72 billion. The company’s full-year revenue guidance of $7.2 billion at the midpoint came in 1.4% above analysts’ estimates. Its GAAP loss of $2.49 per share was significantly below analysts’ consensus estimates.
Is now the time to buy Tapestry? Find out by accessing our full research report, it’s free.
Tapestry (TPR) Q2 CY2025 Highlights:
- Revenue: $1.72 billion vs analyst estimates of $1.68 billion (8.3% year-on-year growth, 2.7% beat)
- EPS (GAAP): -$2.49 vs analyst estimates of $0.98 (significant miss)
- Adjusted EBITDA: $376.6 million vs analyst estimates of $330.6 million (21.9% margin, 13.9% beat)
- EPS (GAAP) guidance for the upcoming financial year 2026 is $5.38 at the midpoint, in line with analyst estimates
- Operating Margin: -33.9%, down from 14.8% in the same quarter last year
- Constant Currency Revenue rose 8% year on year (0% in the same quarter last year)
- Market Capitalization: $23.58 billion
Company Overview
Originally founded as Coach, Tapestry (NYSE: TPR) is an American fashion conglomerate with a portfolio of luxury brands offering high-quality accessories and fashion products.
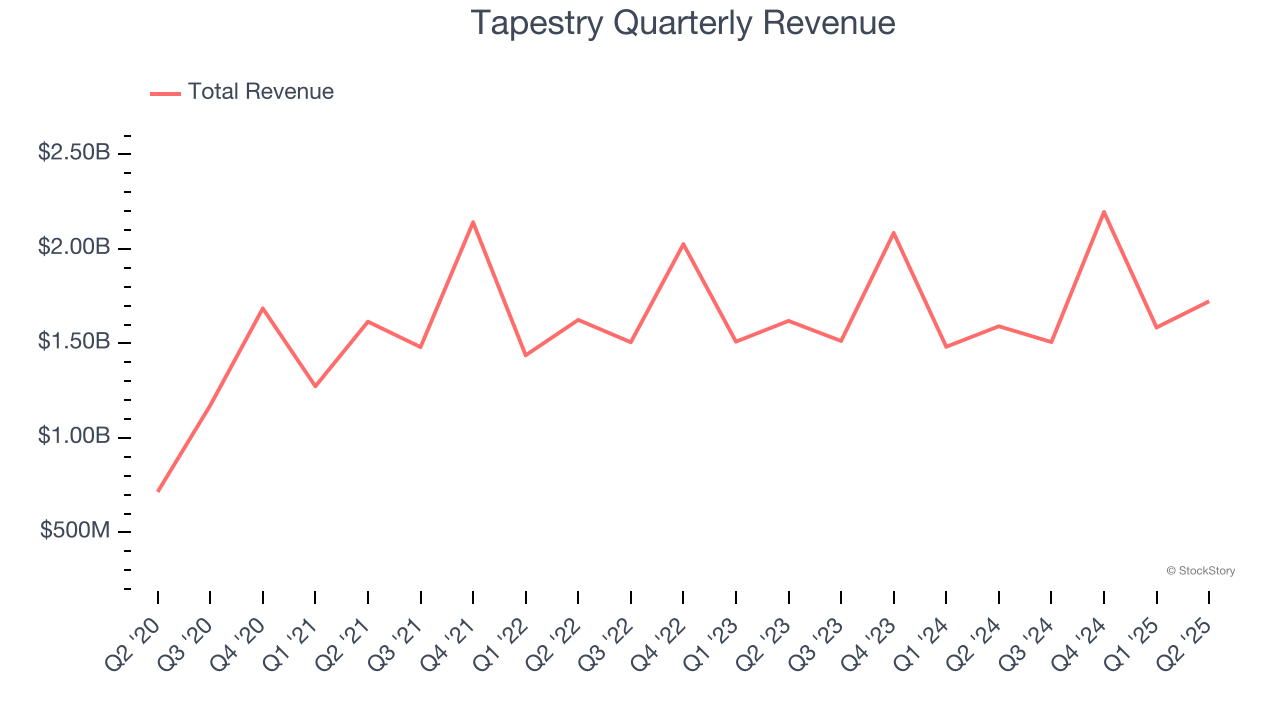
Revenue Growth
Reviewing a company’s long-term sales performance reveals insights into its quality. Any business can put up a good quarter or two, but many enduring ones grow for years. Regrettably, Tapestry’s sales grew at a sluggish 7.2% compounded annual growth rate over the last five years. This fell short of our benchmark for the consumer discretionary sector and is a poor baseline for our analysis.
We at StockStory place the most emphasis on long-term growth, but within consumer discretionary, a stretched historical view may miss a company riding a successful new product or trend. Tapestry’s recent performance shows its demand has slowed as its annualized revenue growth of 2.6% over the last two years was below its five-year trend. 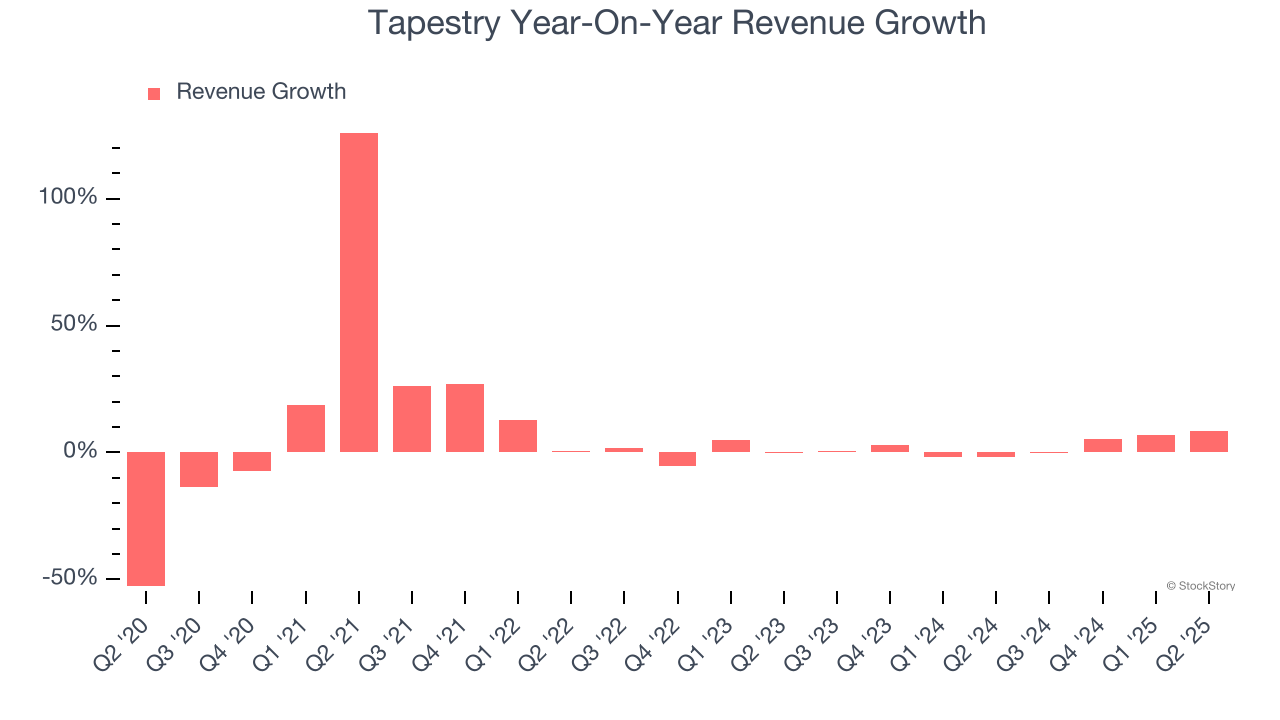
We can better understand the company’s sales dynamics by analyzing its constant currency revenue, which excludes currency movements that are outside their control and not indicative of demand. Over the last two years, its constant currency sales averaged 3.3% year-on-year growth. Because this number aligns with its normal revenue growth, we can see that Tapestry has properly hedged its foreign currency exposure. 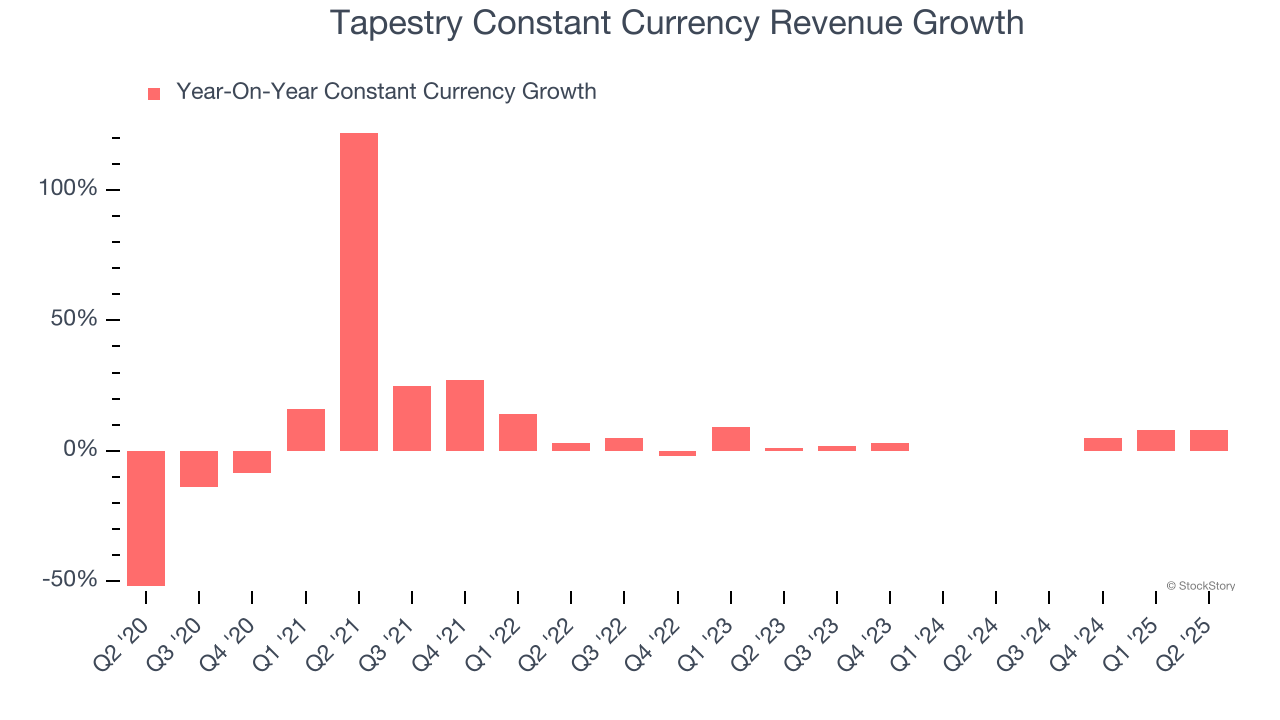
This quarter, Tapestry reported year-on-year revenue growth of 8.3%, and its $1.72 billion of revenue exceeded Wall Street’s estimates by 2.6%.
Looking ahead, sell-side analysts expect revenue to grow 2.1% over the next 12 months, similar to its two-year rate. This projection doesn't excite us and indicates its newer products and services will not lead to better top-line performance yet.
Unless you’ve been living under a rock, it should be obvious by now that generative AI is going to have a huge impact on how large corporations do business. While Nvidia and AMD are trading close to all-time highs, we prefer a lesser-known (but still profitable) stock benefiting from the rise of AI. Click here to access our free report one of our favorites growth stories.
Operating Margin
Operating margin is a key measure of profitability. Think of it as net income - the bottom line - excluding the impact of taxes and interest on debt, which are less connected to business fundamentals.
Tapestry’s operating margin has shrunk over the last 12 months, but it still averaged 11.4% over the last two years, decent for a consumer discretionary business. This shows it generally does a decent job managing its expenses.
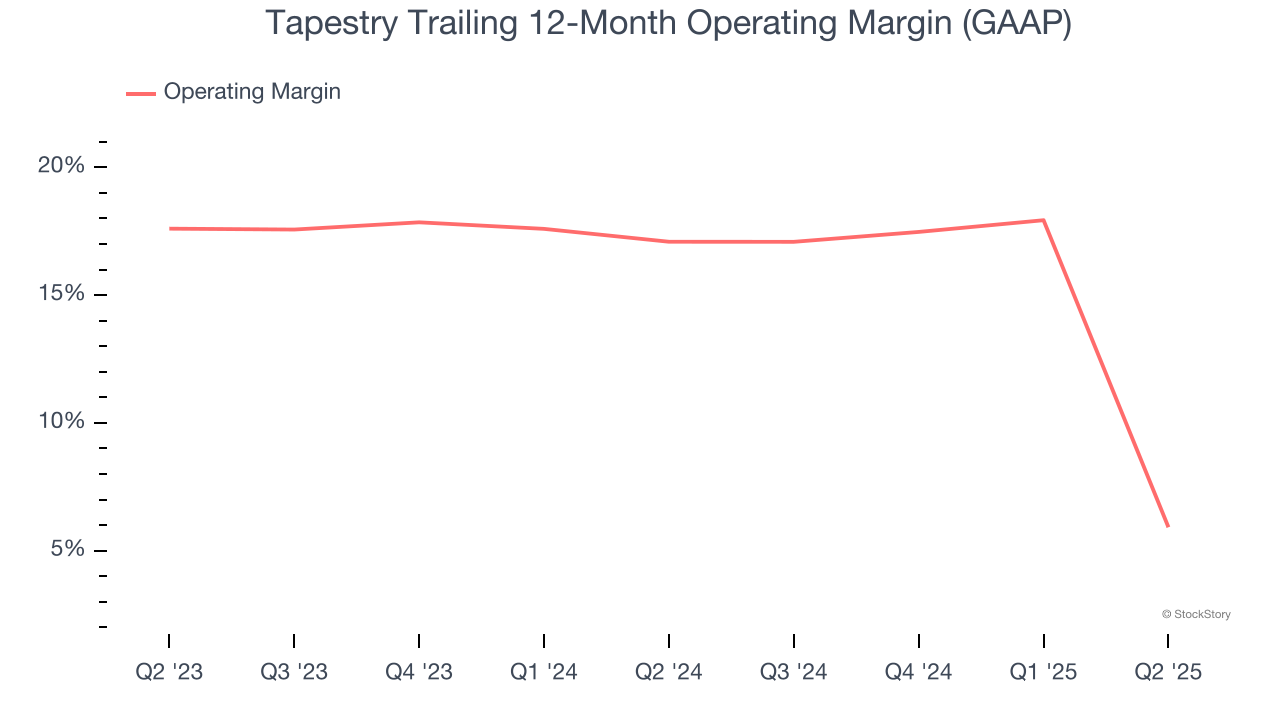
This quarter, Tapestry generated an operating margin profit margin of negative 33.9%, down 48.6 percentage points year on year. This contraction shows it was less efficient because its expenses grew faster than its revenue.
Earnings Per Share
We track the long-term change in earnings per share (EPS) for the same reason as long-term revenue growth. Compared to revenue, however, EPS highlights whether a company’s growth is profitable.
Tapestry’s full-year EPS flipped from negative to positive over the last five years. This is encouraging and shows it’s at a critical moment in its life.
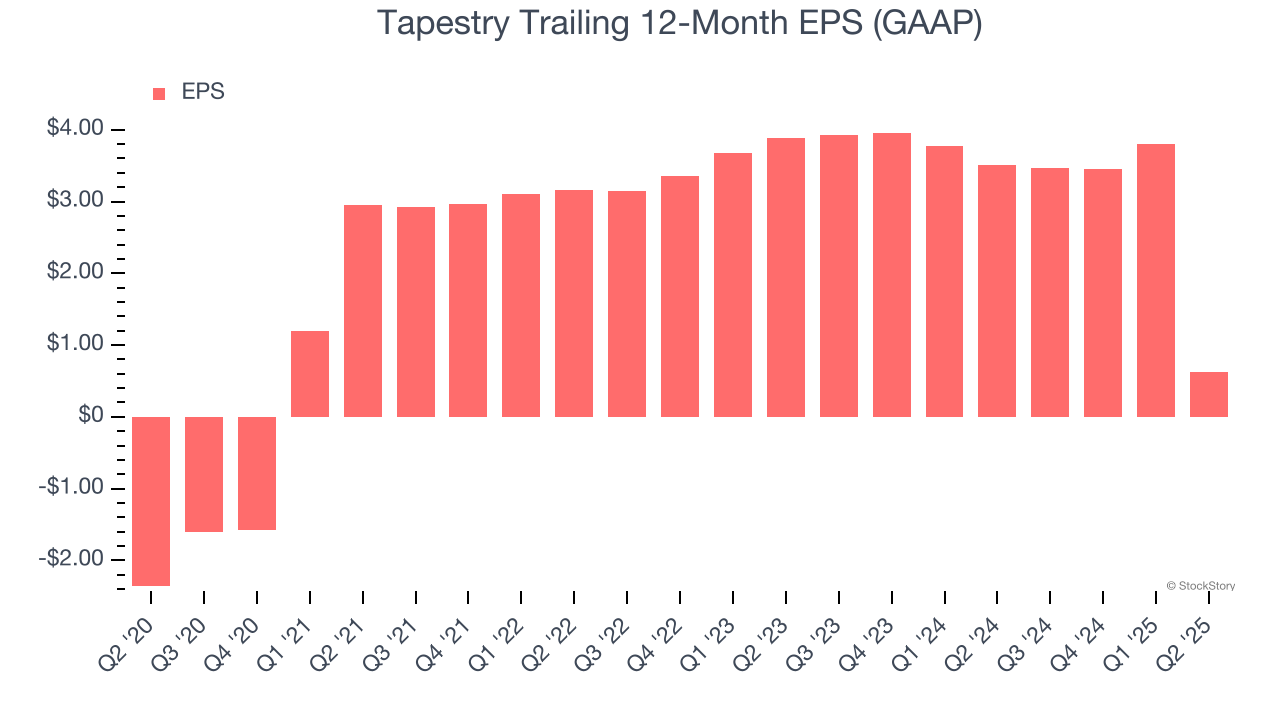
In Q2, Tapestry reported EPS of negative $2.49, down from $0.68 in the same quarter last year. This print missed analysts’ estimates, but we care more about long-term EPS growth than short-term movements. Over the next 12 months, Wall Street expects Tapestry’s full-year EPS of $0.63 to grow 740%.
Key Takeaways from Tapestry’s Q2 Results
We were impressed by how significantly Tapestry blew past analysts’ constant currency revenue expectations this quarter. We were also glad its EBITDA outperformed Wall Street’s estimates. On the other hand, its EPS missed. Investors were likely hoping for more, and shares traded down 16.3% to $95 immediately after reporting.
Should you buy the stock or not? We think that the latest quarter is only one piece of the longer-term business quality puzzle. Quality, when combined with valuation, can help determine if the stock is a buy. We cover that in our actionable full research report which you can read here, it’s free.