Packaged bakery food company Flower Foods (NYSE: FLO) fell short of the market’s revenue expectations in Q2 CY2025 as sales only rose 1.5% year on year to $1.24 billion. The company’s full-year revenue guidance of $5.27 billion at the midpoint came in 0.7% below analysts’ estimates. Its non-GAAP profit of $0.30 per share was in line with analysts’ consensus estimates.
Is now the time to buy Flowers Foods? Find out by accessing our full research report, it’s free.
Flowers Foods (FLO) Q2 CY2025 Highlights:
- Revenue: $1.24 billion vs analyst estimates of $1.27 billion (1.5% year-on-year growth, 2% miss)
- Adjusted EPS: $0.30 vs analyst estimates of $0.29 (in line)
- Adjusted EBITDA: $137.7 million vs analyst estimates of $141.3 million (11.1% margin, 2.6% miss)
- The company dropped its revenue guidance for the full year to $5.27 billion at the midpoint from $5.35 billion, a 1.4% decrease
- Management lowered its full-year Adjusted EPS guidance to $1.05 at the midpoint, a 4.5% decrease
- EBITDA guidance for the full year is $525 million at the midpoint, below analyst estimates of $545.9 million
- Operating Margin: 7.5%, down from 8.7% in the same quarter last year
- Free Cash Flow Margin: 8%, up from 2.9% in the same quarter last year
- Organic Revenue fell 3.6% year on year vs analyst estimates of 2.1% declines (151.5 basis point miss)
- Sales Volumes fell 2.4% year on year (-1.2% in the same quarter last year)
- Market Capitalization: $3.50 billion
Company Overview
With Wonder Bread as its premier brand, Flower Foods (NYSE: FLO) is a packaged foods company that focuses on bakery products such as breads, buns, and cakes.
Revenue Growth
A company’s long-term performance is an indicator of its overall quality. Any business can put up a good quarter or two, but many enduring ones grow for years.
With $5.10 billion in revenue over the past 12 months, Flowers Foods carries some recognizable products but is a mid-sized consumer staples company. Its size could bring disadvantages compared to larger competitors benefiting from better brand awareness and economies of scale.
As you can see below, Flowers Foods grew its sales at a sluggish 3.7% compounded annual growth rate over the last three years as consumers bought less of its products. We’ll explore what this means in the "Volume Growth" section.
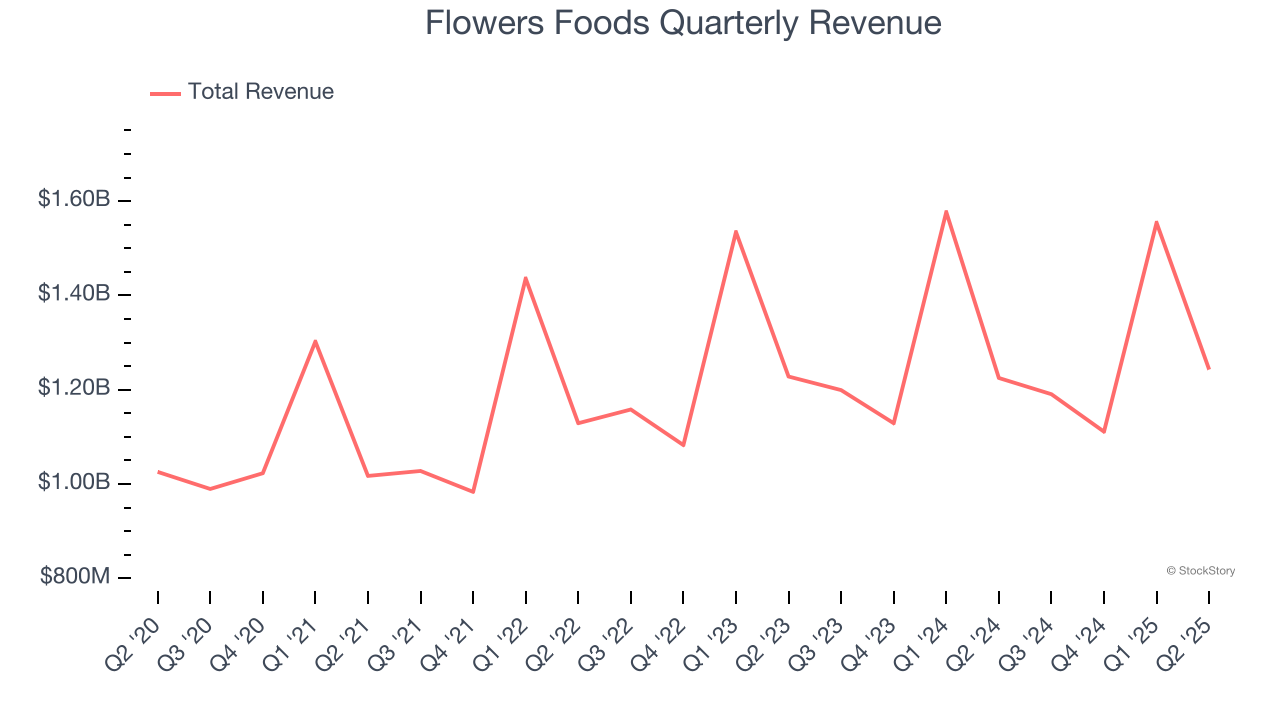
This quarter, Flowers Foods’s revenue grew by 1.5% year on year to $1.24 billion, falling short of Wall Street’s estimates.
Looking ahead, sell-side analysts expect revenue to grow 5.4% over the next 12 months, an acceleration versus the last three years. This projection is above average for the sector and indicates its newer products will spur better top-line performance.
Today’s young investors won’t have read the timeless lessons in Gorilla Game: Picking Winners In High Technology because it was written more than 20 years ago when Microsoft and Apple were first establishing their supremacy. But if we apply the same principles, then enterprise software stocks leveraging their own generative AI capabilities may well be the Gorillas of the future. So, in that spirit, we are excited to present our Special Free Report on a profitable, fast-growing enterprise software stock that is already riding the automation wave and looking to catch the generative AI next.
Volume Growth
Revenue growth can be broken down into changes in price and volume (the number of units sold). While both are important, volume is the lifeblood of a successful staples business as there’s a ceiling to what consumers will pay for everyday goods; they can always trade down to non-branded products if the branded versions are too expensive.
To analyze whether Flowers Foods generated its growth (or lack thereof) from changes in price or volume, we can compare its volume growth to its organic revenue growth, which excludes non-fundamental impacts on company financials like mergers and currency fluctuations.
Over the last two years, Flowers Foods’s average quarterly volumes have shrunk by 1.3%. This isn’t ideal for a consumer staples company, where demand is typically stable. In the context of its 1.8% average organic sales declines, we can see that most of the company’s losses have come from fewer customers purchasing its products.
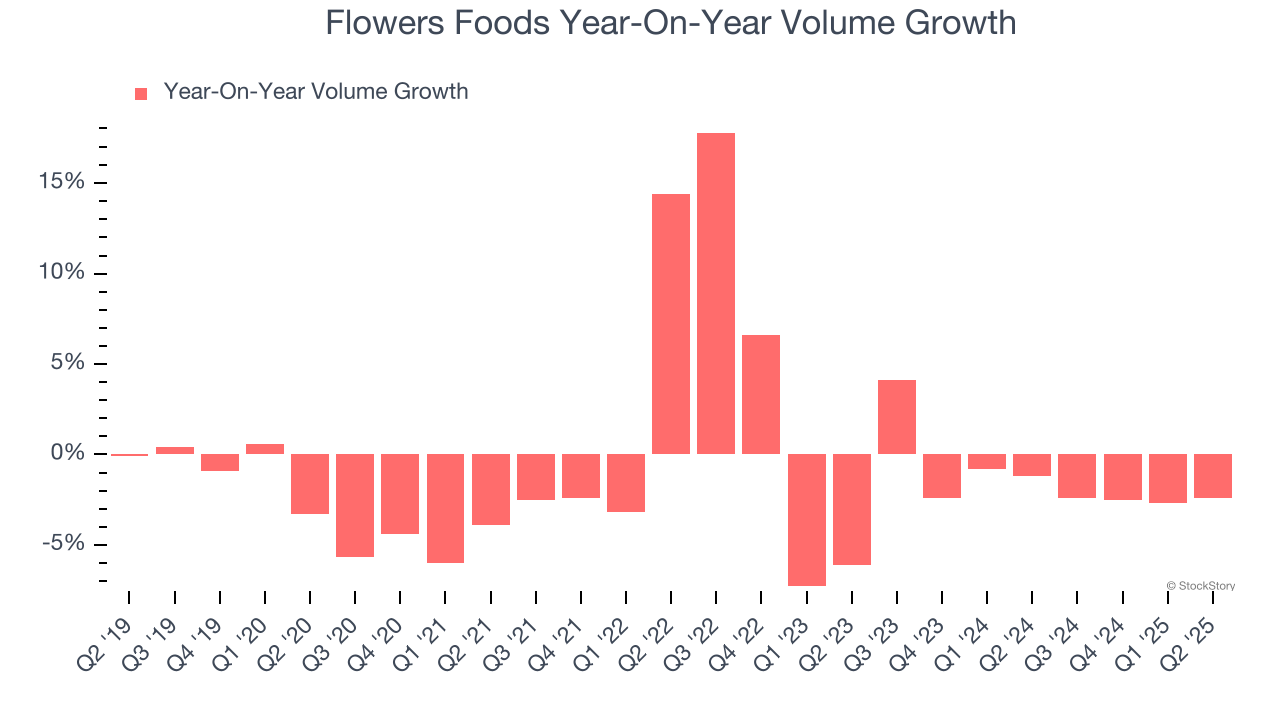
In Flowers Foods’s Q2 2025, sales volumes dropped 2.4% year on year. This result represents a further deceleration from its historical levels, showing the business is struggling to move its products.
Key Takeaways from Flowers Foods’s Q2 Results
We struggled to find many positives in these results. Its EBITDA missed and its organic revenue fell short of Wall Street’s estimates. Overall, this was a softer quarter. The stock traded down 5.3% to $15.70 immediately following the results.
Flowers Foods’s latest earnings report disappointed. One quarter doesn’t define a company’s quality, so let’s explore whether the stock is a buy at the current price. What happened in the latest quarter matters, but not as much as longer-term business quality and valuation, when deciding whether to invest in this stock. We cover that in our actionable full research report which you can read here, it’s free.