
Home improvement retail giant Home Depot (NYSE: HD) met Wall Street’s revenue expectations in Q2 CY2025, with sales up 4.9% year on year to $45.28 billion. Its non-GAAP profit of $4.68 per share was in line with analysts’ consensus estimates.
Is now the time to buy Home Depot? Find out by accessing our full research report, it’s free.
Home Depot (HD) Q2 CY2025 Highlights:
- Revenue: $45.28 billion vs analyst estimates of $45.27 billion (4.9% year-on-year growth, in line)
- Adjusted EPS: $4.68 vs analyst expectations of $4.69 (in line)
- Full year 2025 guidance largely reaffirmed
- Operating Margin: 14.5%, in line with the same quarter last year
- Free Cash Flow Margin: 8.2%, down from 10.9% in the same quarter last year
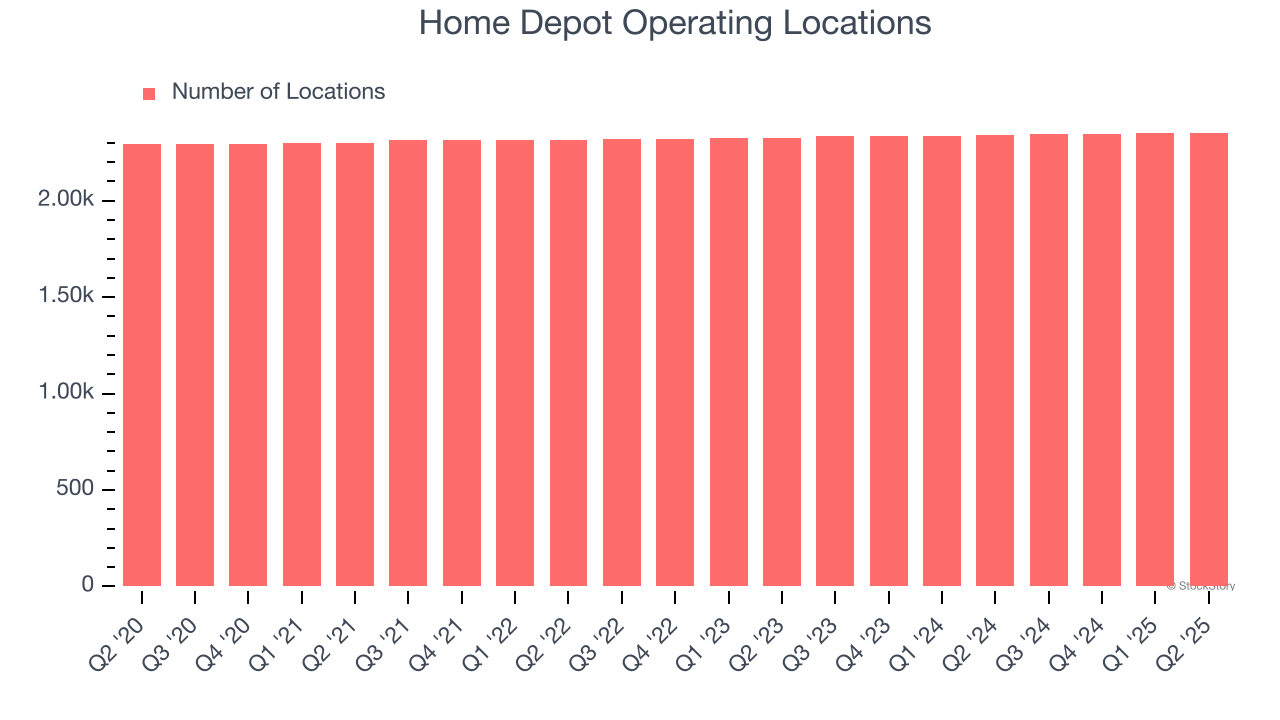
- Locations: 2,353 at quarter end, up from 2,340 in the same quarter last year
- Same-Store Sales rose 1% year on year (-3.3% in the same quarter last year)
- Market Capitalization: $392.7 billion
"Our second quarter results were in line with our expectations. The momentum that began in the back half of last year continued throughout the first half as customers engaged more broadly in smaller home improvement projects," said Ted Decker, chair, president and CEO.
Company Overview
Founded and headquartered in Atlanta, Georgia, Home Depot (NYSE: HD) is a home improvement retailer that sells everything from tools to building materials to appliances.
Revenue Growth
Reviewing a company’s long-term sales performance reveals insights into its quality.
Any business can put up a good quarter or two, but many enduring ones grow for years.
With $165.1 billion in revenue over the past 12 months, Home Depot is a behemoth in the consumer retail sector and benefits from economies of scale, giving it an edge in distribution. This also enables it to gain more leverage on its fixed costs than smaller competitors and the flexibility to offer lower prices. However, its scale is a double-edged sword because it’s harder to find incremental growth when you’ve penetrated most of the market. To accelerate sales, Home Depot likely needs to optimize its pricing or lean into international expansion.
As you can see below, Home Depot’s sales grew at a tepid 7% compounded annual growth rate over the last six years (we compare to 2019 to normalize for COVID-19 impacts) as it didn’t open many new stores.
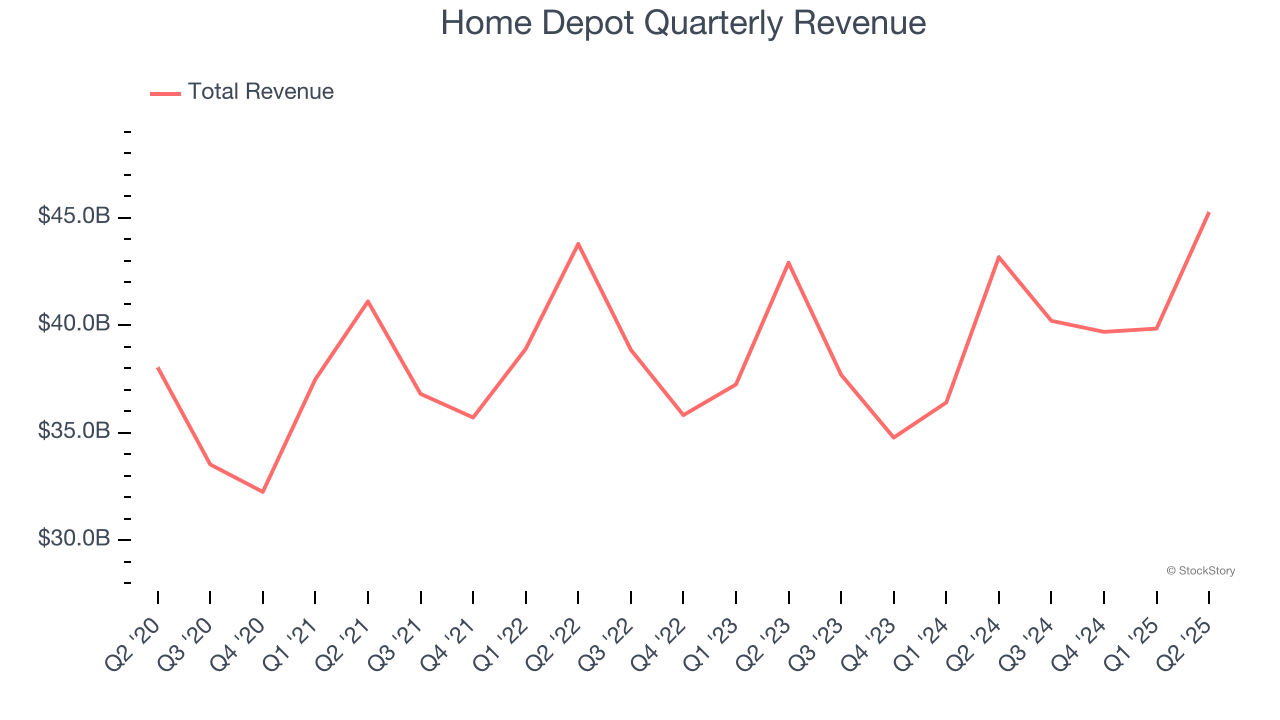
This quarter, Home Depot grew its revenue by 4.9% year on year, and its $45.28 billion of revenue was in line with Wall Street’s estimates.
Looking ahead, sell-side analysts expect revenue to grow 1.4% over the next 12 months, a deceleration versus the last six years. This projection doesn't excite us and suggests its products will see some demand headwinds.
Software is eating the world and there is virtually no industry left that has been untouched by it. That drives increasing demand for tools helping software developers do their jobs, whether it be monitoring critical cloud infrastructure, integrating audio and video functionality, or ensuring smooth content streaming. Click here to access a free report on our 3 favorite stocks to play this generational megatrend.
Store Performance
Number of Stores
A retailer’s store count often determines how much revenue it can generate.
Home Depot operated 2,353 locations in the latest quarter, and over the last two years, has kept its store count flat while other consumer retail businesses have opted for growth.
When a retailer keeps its store footprint steady, it usually means demand is stable and it’s focusing on operational efficiency to increase profitability.
Same-Store Sales
The change in a company's store base only tells one side of the story. The other is the performance of its existing locations and e-commerce sales, which informs management teams whether they should expand or downsize their physical footprints. Same-store sales gives us insight into this topic because it measures organic growth for a retailer's e-commerce platform and brick-and-mortar shops that have existed for at least a year.
Home Depot’s demand has been shrinking over the last two years as its same-store sales have averaged 1.6% annual declines. This performance isn’t ideal, and we’d be concerned if Home Depot starts opening new stores to artificially boost revenue growth.
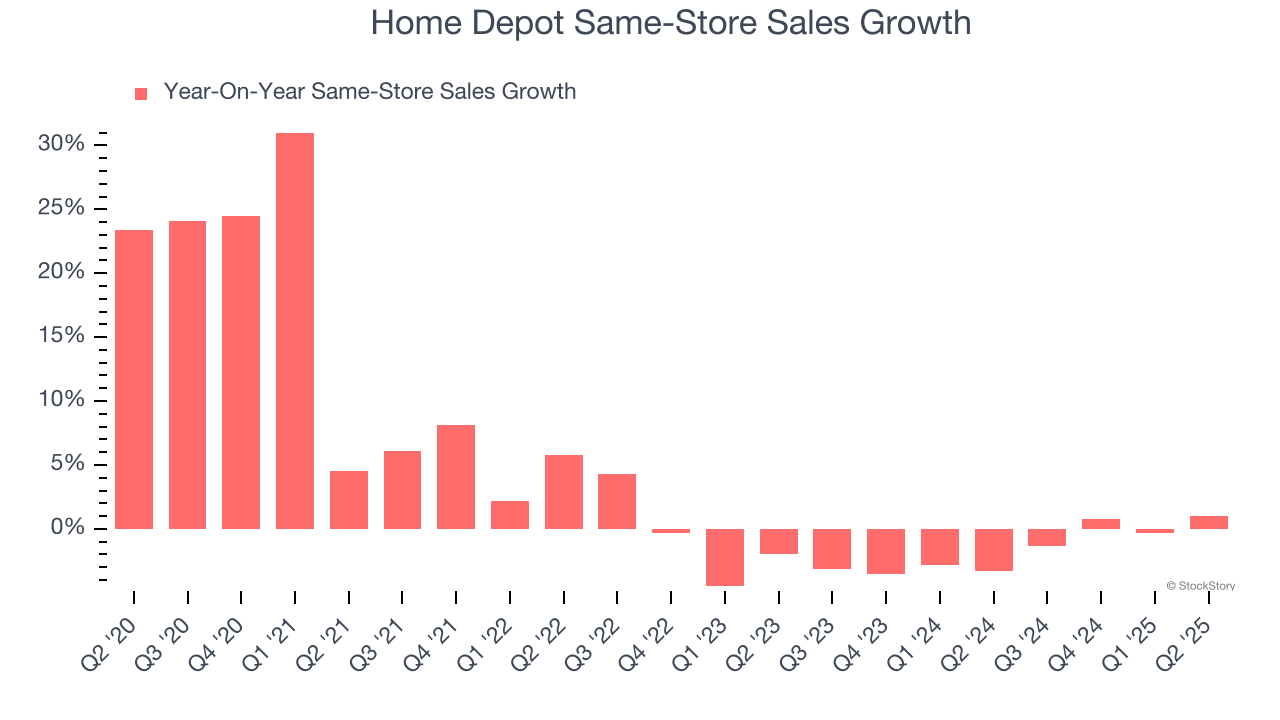
In the latest quarter, Home Depot’s same-store sales rose 1% year on year. This growth was a well-appreciated turnaround from its historical levels, showing the business is regaining momentum.
Key Takeaways from Home Depot’s Q2 Results
Revenue and EPS were both in line, which is not too exciting. Full-year 2025 guidance was largely reaffirmed. The stock traded down 1.7% to $388 immediately following the results.
Home Depot’s latest earnings report disappointed. One quarter doesn’t define a company’s quality, so let’s explore whether the stock is a buy at the current price. What happened in the latest quarter matters, but not as much as longer-term business quality and valuation, when deciding whether to invest in this stock. We cover that in our actionable full research report which you can read here, it’s free.