
Quarterly earnings results are a good time to check in on a company’s progress, especially compared to its peers in the same sector. Today we are looking at Tecnoglass (NYSE: TGLS) and the best and worst performers in the building materials industry.
Traditionally, building materials companies have built competitive advantages with economies of scale, brand recognition, and strong relationships with builders and contractors. More recently, advances to address labor availability and job site productivity have spurred innovation. Additionally, companies in the space that can produce more energy-efficient materials have opportunities to take share. However, these companies are at the whim of construction volumes, which tend to be cyclical and can be impacted heavily by economic factors such as interest rates. Additionally, the costs of raw materials can be driven by a myriad of worldwide factors and greatly influence the profitability of building materials companies.
The 8 building materials stocks we track reported a mixed Q2. As a group, revenues beat analysts’ consensus estimates by 1% while next quarter’s revenue guidance was in line.
Thankfully, share prices of the companies have been resilient as they are up 7.3% on average since the latest earnings results.
Tecnoglass (NYSE: TGLS)
The first-ever Colombian company to trade on the NASDAQ, Tecnoglass (NYSE: TGLS) is a manufacturer of architectural glass, windows, and aluminum products.
Tecnoglass reported revenues of $255.5 million, up 16.3% year on year. This print exceeded analysts’ expectations by 4.3%. Overall, it was a very strong quarter for the company with an impressive beat of analysts’ EBITDA estimates and a solid beat of analysts’ adjusted operating income estimates.
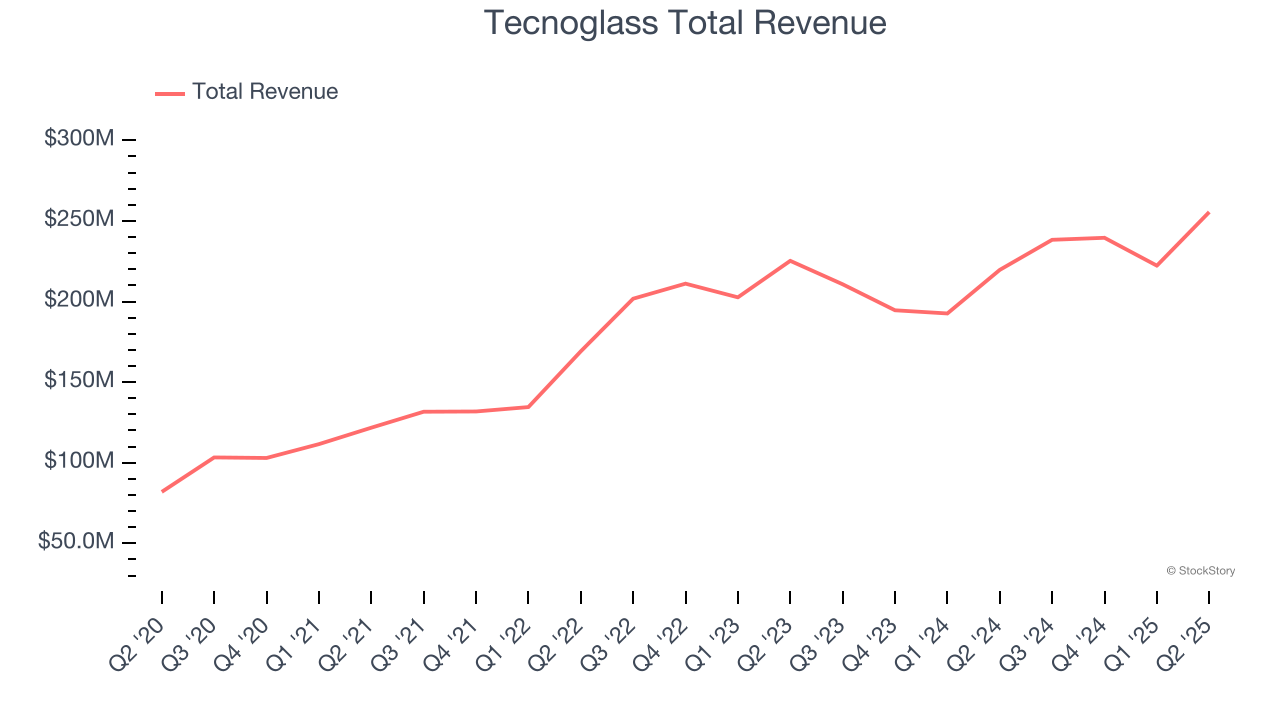
Unsurprisingly, the stock is down 7.4% since reporting and currently trades at $72.51.
Is now the time to buy Tecnoglass? Access our full analysis of the earnings results here, it’s free.
Best Q2: Armstrong World (NYSE: AWI)
Started as a two-man shop dating back to the 1860s, Armstrong (NYSE: AWI) provides ceiling and wall products to commercial and residential spaces.
Armstrong World reported revenues of $424.6 million, up 16.3% year on year, outperforming analysts’ expectations by 5.2%. The business had a stunning quarter with an impressive beat of analysts’ organic revenue estimates and a solid beat of analysts’ EBITDA estimates.
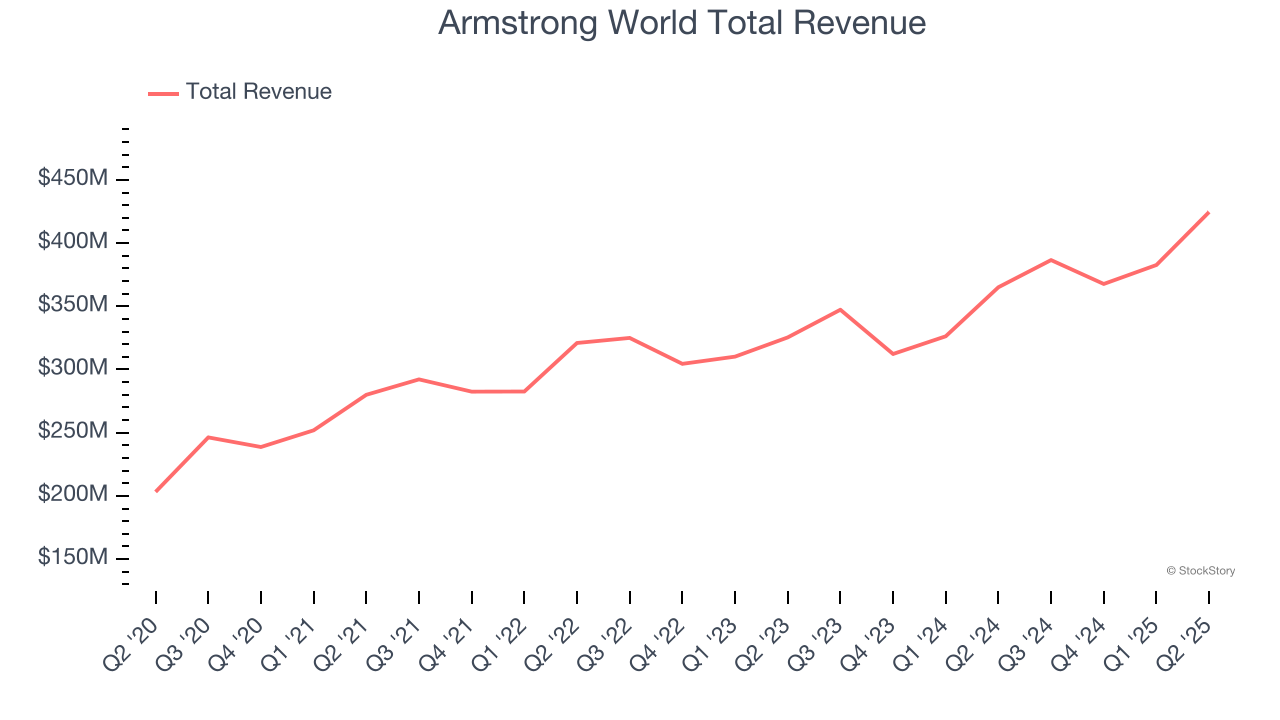
The market seems happy with the results as the stock is up 15.6% since reporting. It currently trades at $195.27.
Is now the time to buy Armstrong World? Access our full analysis of the earnings results here, it’s free.
Weakest Q2: Carlisle (NYSE: CSL)
Originally founded as Carlisle Tire and Rubber Company, Carlisle Companies (NYSE: CSL) is a multi-industry product manufacturer focusing on construction materials and weatherproofing technologies.
Carlisle reported revenues of $1.45 billion, flat year on year, falling short of analysts’ expectations by 3.2%. It was a disappointing quarter as it posted a significant miss of analysts’ adjusted operating income estimates and a significant miss of analysts’ EBITDA estimates.
As expected, the stock is down 5.4% since the results and currently trades at $387.
Read our full analysis of Carlisle’s results here.
Sherwin-Williams (NYSE: SHW)
Widely known for its success in the paint industry, Sherwin-Williams (NYSE: SHW) is a manufacturer of paints, coatings, and related products.
Sherwin-Williams reported revenues of $6.31 billion, flat year on year. This print was in line with analysts’ expectations. More broadly, it was a softer quarter as it logged full-year EPS guidance missing analysts’ expectations significantly and a significant miss of analysts’ adjusted operating income estimates.
The stock is up 7.6% since reporting and currently trades at $367.93.
Read our full, actionable report on Sherwin-Williams here, it’s free.
UFP Industries (NASDAQ: UFPI)
Beginning as a lumber supplier in the 1950s, UFP Industries (NASDAQ: UFPI) is a holding company making building materials for the construction, retail, and industrial sectors.
UFP Industries reported revenues of $1.84 billion, down 3.5% year on year. This result missed analysts’ expectations by 1.9%. It was a disappointing quarter as it also recorded a significant miss of analysts’ adjusted operating income estimates and a significant miss of analysts’ EPS estimates.
UFP Industries had the slowest revenue growth among its peers. The stock is up 1.1% since reporting and currently trades at $105.51.
Read our full, actionable report on UFP Industries here, it’s free.
Market Update
The Fed’s interest rate hikes throughout 2022 and 2023 have successfully cooled post-pandemic inflation, bringing it closer to the 2% target. Inflationary pressures have eased without tipping the economy into a recession, suggesting a soft landing. This stability, paired with recent rate cuts (0.5% in September 2024 and 0.25% in November 2024), fueled a strong year for the stock market in 2024. The markets surged further after Donald Trump’s presidential victory in November, with major indices reaching record highs in the days following the election. Still, questions remain about the direction of economic policy, as potential tariffs and corporate tax changes add uncertainty for 2025.
Want to invest in winners with rock-solid fundamentals? Check out our Top 5 Quality Compounder Stocks and add them to your watchlist. These companies are poised for growth regardless of the political or macroeconomic climate.
StockStory is growing and hiring equity analyst and marketing roles. Are you a 0 to 1 builder passionate about the markets and AI? See the open roles here.


