Over the past six months, Nova’s stock price fell to $254.36. Shareholders have lost 7% of their capital, which is disappointing considering the S&P 500 has climbed by 4.7%. This may have investors wondering how to approach the situation.
Following the pullback, is this a buying opportunity for NVMI? Find out in our full research report, it’s free.
Why Are We Positive On Nova?
Headquartered in Israel, Nova (NASDAQ: NVMI) is a provider of quality control systems used in semiconductor manufacturing.
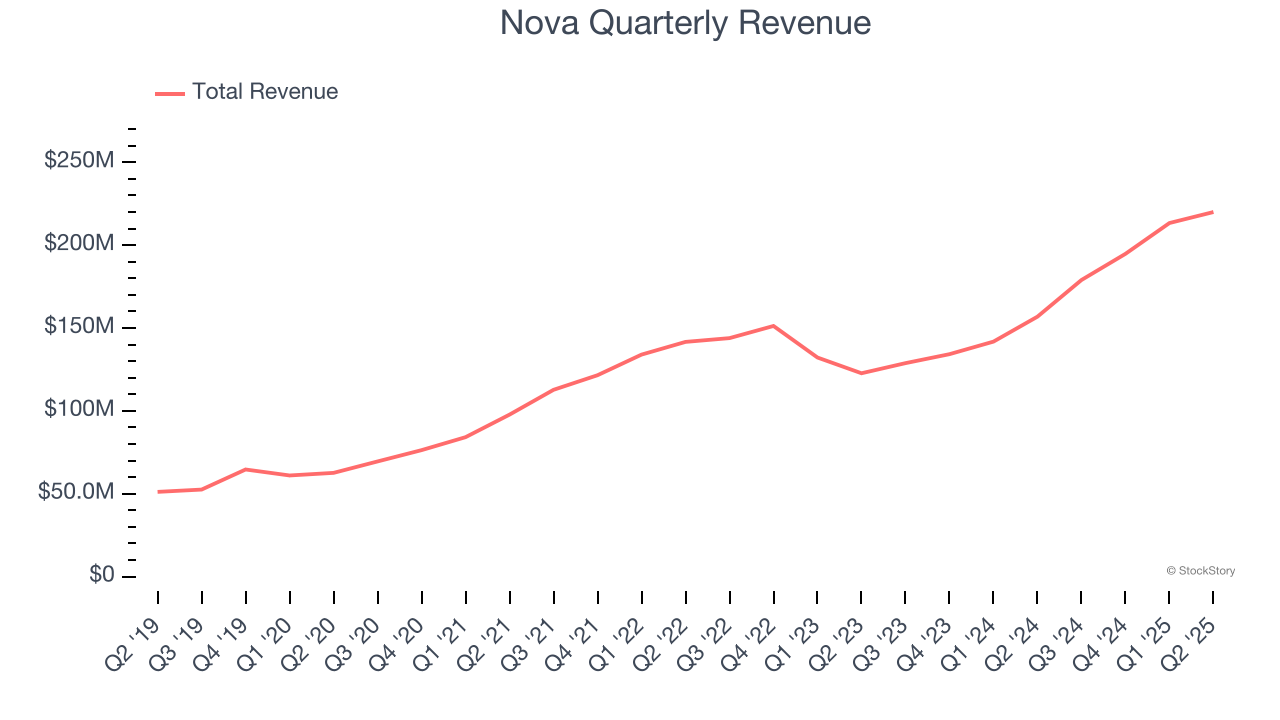
1. Skyrocketing Revenue Shows Strong Momentum
Reviewing a company’s long-term sales performance reveals insights into its quality. Any business can put up a good quarter or two, but the best consistently grow over the long haul. Over the last five years, Nova grew its sales at an incredible 27.4% compounded annual growth rate. Its growth surpassed the average semiconductor company and shows its offerings resonate with customers. Semiconductors are a cyclical industry, and long-term investors should be prepared for periods of high growth followed by periods of revenue contractions (which can sometimes offer opportune times to buy).
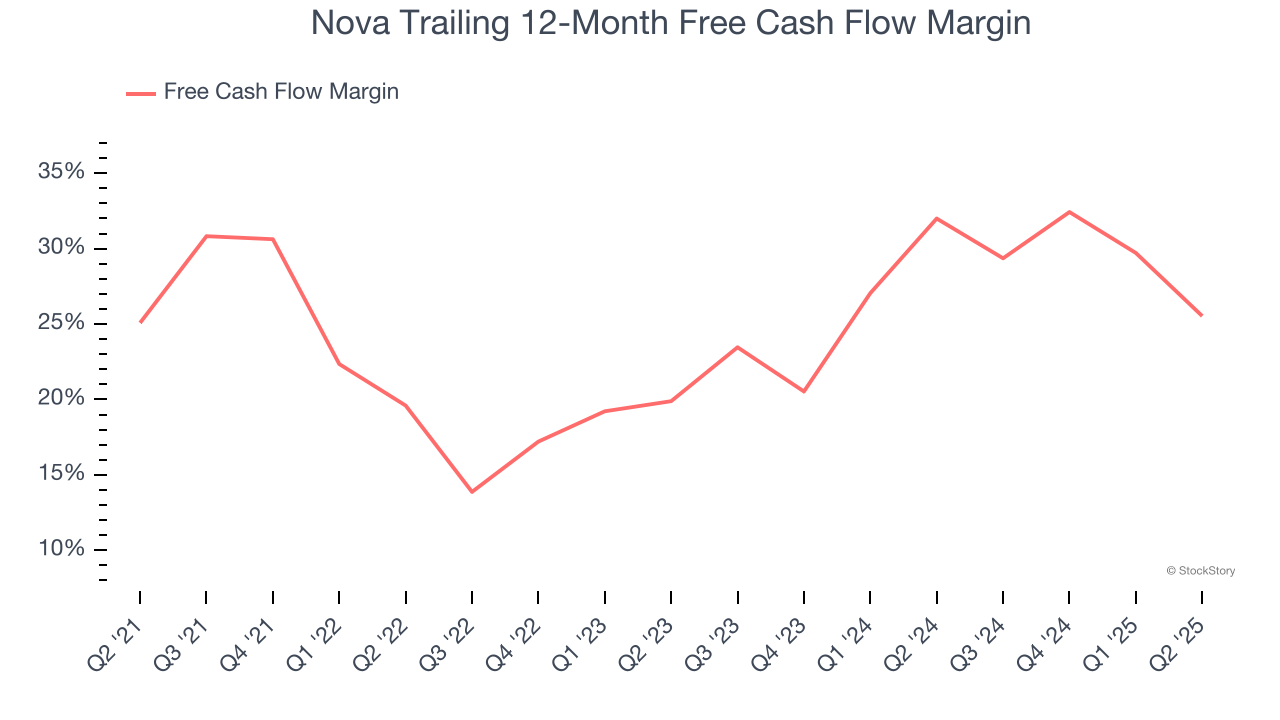
2. Excellent Free Cash Flow Margin Boosts Reinvestment Potential
If you’ve followed StockStory for a while, you know we emphasize free cash flow. Why, you ask? We believe that in the end, cash is king, and you can’t use accounting profits to pay the bills.
Nova has shown terrific cash profitability, and if sustainable, puts it in an advantageous position to invest in new products, return capital to investors, and consolidate the market during industry downturns. The company’s free cash flow margin was among the best in the semiconductor sector, averaging 28.2% over the last two years.
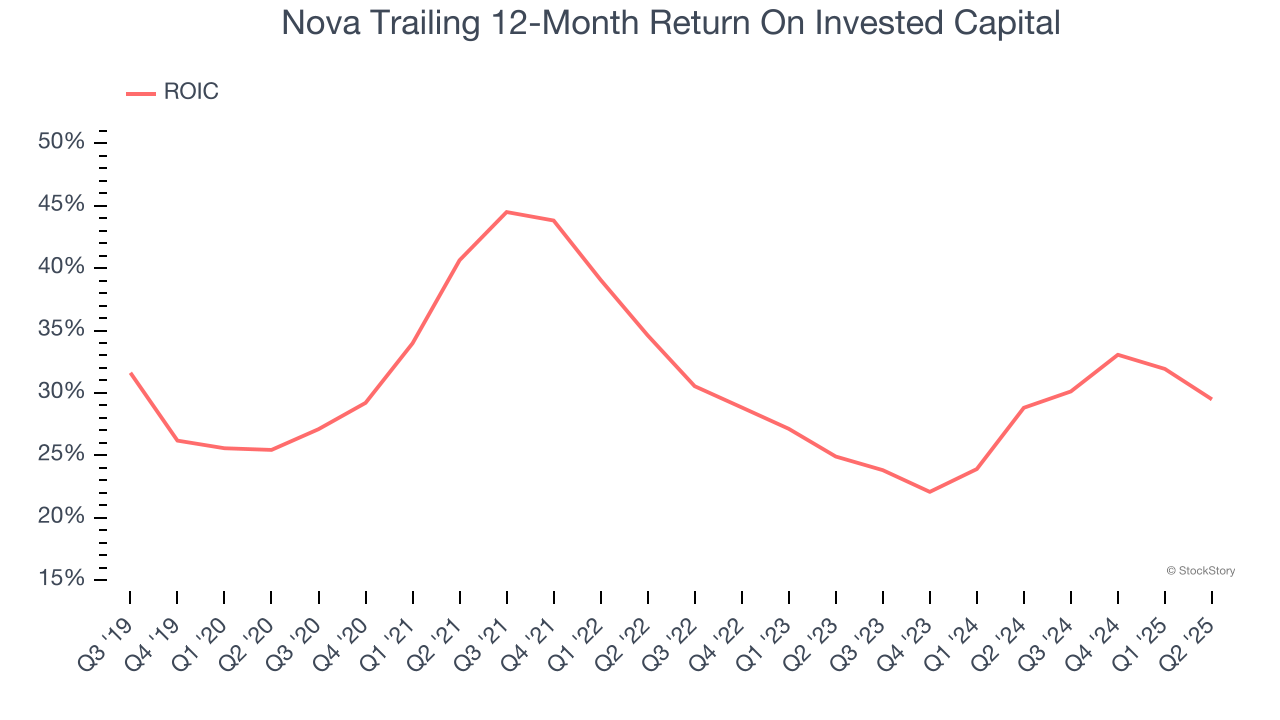
3. Stellar ROIC Showcases Lucrative Growth Opportunities
Growth gives us insight into a company’s long-term potential, but how capital-efficient was that growth? A company’s ROIC explains this by showing how much operating profit it makes compared to the money it has raised (debt and equity).
Nova’s five-year average ROIC was 31.7%, placing it among the best semiconductor companies. This illustrates its management team’s ability to invest in highly profitable ventures and produce tangible results for shareholders.
Final Judgment
These are just a few reasons why Nova is a cream-of-the-crop semiconductor company. With the recent decline, the stock trades at 28.6× forward P/E (or $254.36 per share). Is now a good time to initiate a position? See for yourself in our full research report, it’s free.
Stocks We Like Even More Than Nova
Trump’s April 2025 tariff bombshell triggered a massive market selloff, but stocks have since staged an impressive recovery, leaving those who panic sold on the sidelines.
Take advantage of the rebound by checking out our Top 9 Market-Beating Stocks. This is a curated list of our High Quality stocks that have generated a market-beating return of 183% over the last five years (as of March 31st 2025).
Stocks that made our list in 2020 include now familiar names such as Nvidia (+1,545% between March 2020 and March 2025) as well as under-the-radar businesses like the once-micro-cap company Tecnoglass (+1,754% five-year return). Find your next big winner with StockStory today.
StockStory is growing and hiring equity analyst and marketing roles. Are you a 0 to 1 builder passionate about the markets and AI? See the open roles here.