
Over the past six months, Navient’s stock price fell to $12.80. Shareholders have lost 8.7% of their capital, which is disappointing considering the S&P 500 has climbed by 6.4%. This may have investors wondering how to approach the situation.
Is there a buying opportunity in Navient, or does it present a risk to your portfolio? Dive into our full research report to see our analyst team’s opinion, it’s free.
Why Do We Think Navient Will Underperform?
Even with the cheaper entry price, we're cautious about Navient. Here are three reasons why there are better opportunities than NAVI and a stock we'd rather own.
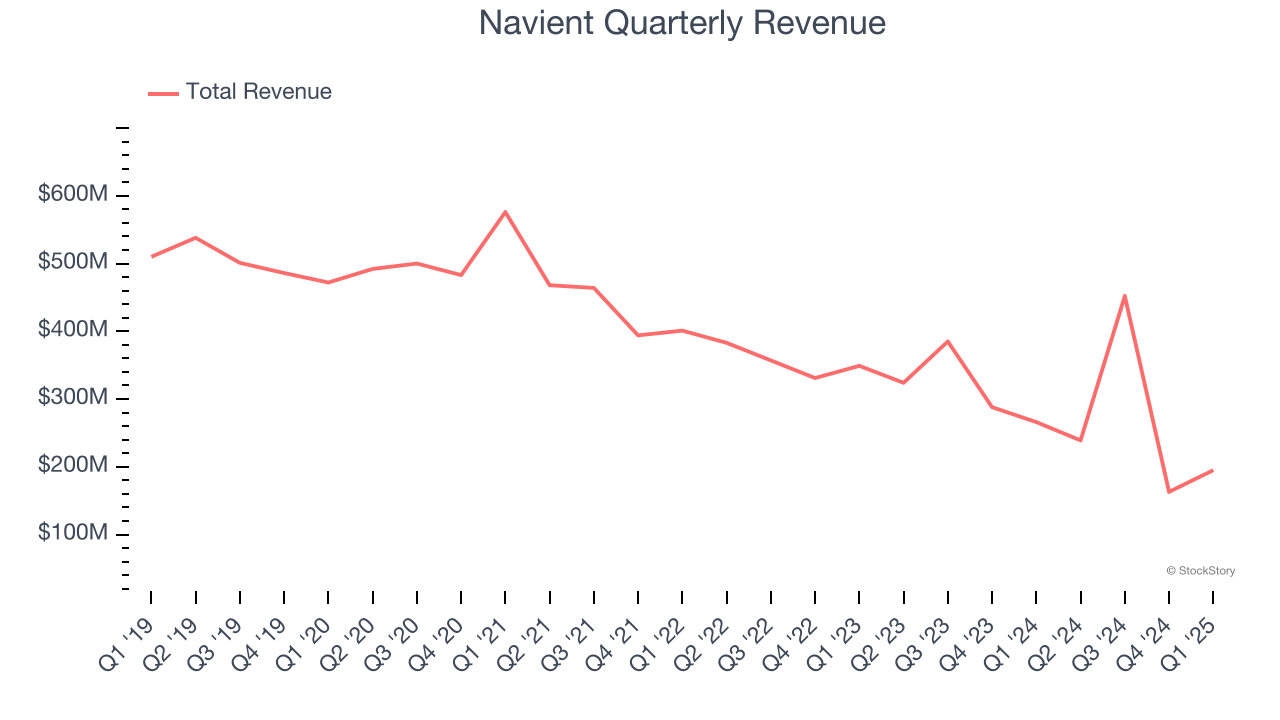
1. Revenue Spiraling Downwards
In general, banks make money from two primary sources. The first is net interest income, which is interest earned on loans, mortgages, and investments in securities minus interest paid out on deposits. The second source is non-interest income, which can come from bank account, credit card, wealth management, investing banking, and trading fees.
Navient struggled to consistently generate demand over the last five years as its revenue dropped at a 12.1% annual rate. This wasn’t a great result and is a sign of poor business quality.
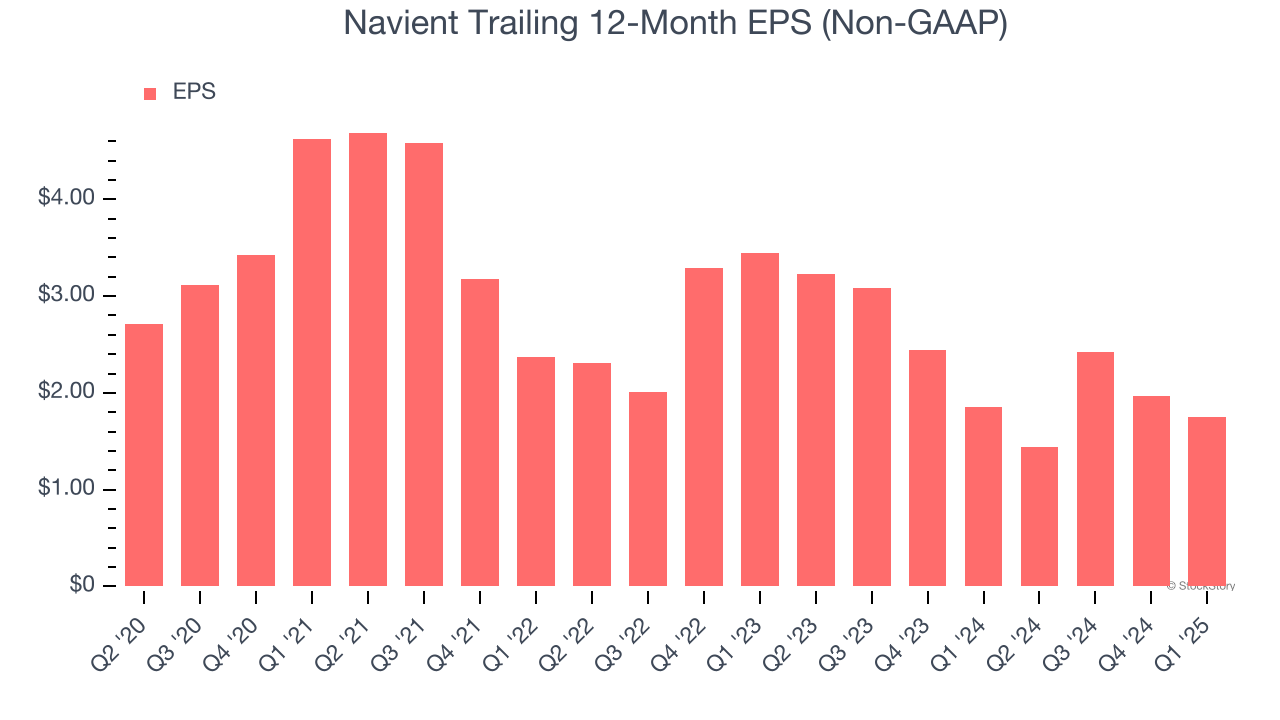
2. EPS Trending Down
We track the long-term change in earnings per share (EPS) because it highlights whether a company’s growth is profitable.
Sadly for Navient, its EPS and revenue declined by 4.1% and 12.1% annually over the last five years. We tend to steer our readers away from companies with falling revenue and EPS, where diminishing earnings could imply changing secular trends and preferences. If the tide turns unexpectedly, Navient’s low margin of safety could leave its stock price susceptible to large downswings.
The debt-to-equity ratio is a widely used measure to assess a company's balance sheet health. A higher ratio means that a business aggressively financed its growth with debt. This can result in higher earnings (if the borrowed funds are invested profitably) but also increases risk.
If debt levels are too high, there could be difficulties in meeting obligations, especially during economic downturns or periods of rising interest rates if the debt has variable-rate payments.
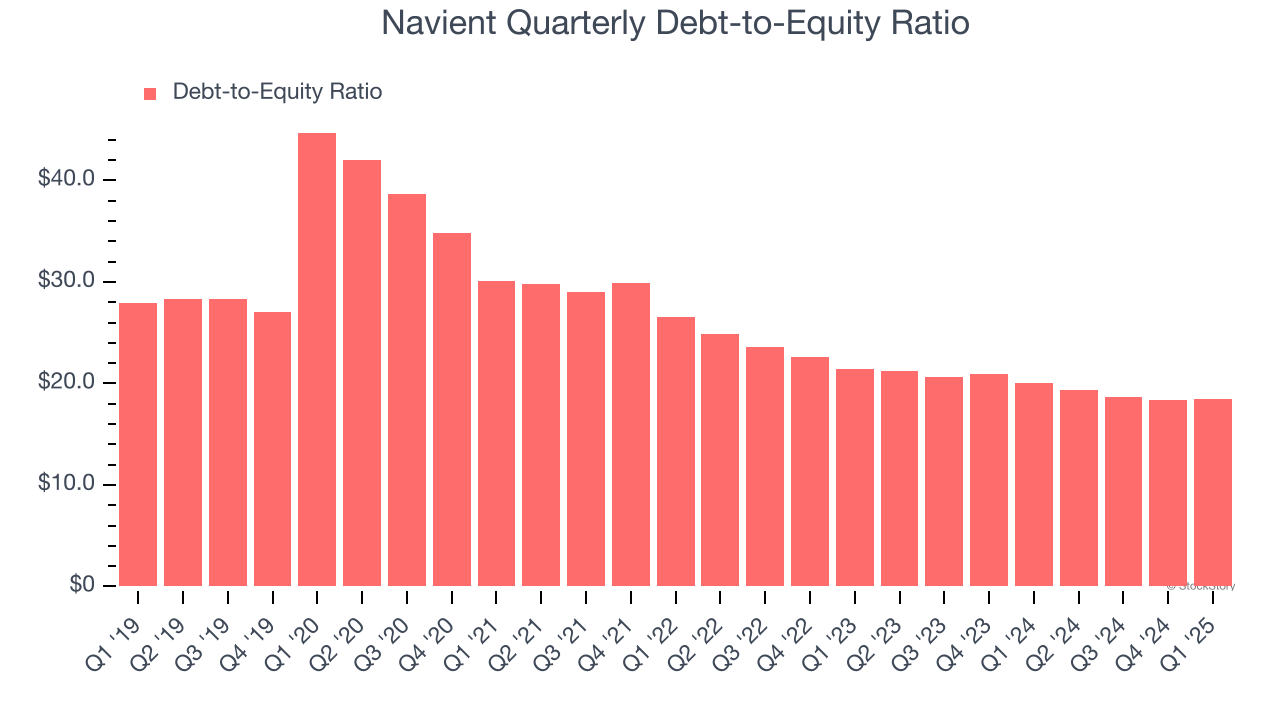
Navient currently has $47.92 billion of debt and $2.59 billion of shareholder's equity on its balance sheet, and over the past four quarters, has averaged a debt-to-equity ratio of 18.7×. We think this is dangerous - for an insurance business, anything above 1.0× raises red flags.
Final Judgment
We see the value of companies driving economic growth, but in the case of Navient, we’re out. After the recent drawdown, the stock trades at 11.6× forward P/E (or $12.80 per share). While this valuation is optically cheap, the potential downside is huge given its shaky fundamentals. There are better investments elsewhere. Let us point you toward a top digital advertising platform riding the creator economy.
Stocks We Would Buy Instead of Navient
Trump’s April 2025 tariff bombshell triggered a massive market selloff, but stocks have since staged an impressive recovery, leaving those who panic sold on the sidelines.
Take advantage of the rebound by checking out our Top 5 Strong Momentum Stocks for this week. This is a curated list of our High Quality stocks that have generated a market-beating return of 183% over the last five years (as of March 31st 2025).
Stocks that made our list in 2020 include now familiar names such as Nvidia (+1,545% between March 2020 and March 2025) as well as under-the-radar businesses like the once-micro-cap company Tecnoglass (+1,754% five-year return). Find your next big winner with StockStory today.
StockStory is growing and hiring equity analyst and marketing roles. Are you a 0 to 1 builder passionate about the markets and AI? See the open roles here.