Off-price retail company Ross Stores (NASDAQ: ROST) met Wall Street’s revenue expectations in Q2 CY2025, with sales up 4.6% year on year to $5.53 billion. Its GAAP profit of $1.56 per share was 1.4% above analysts’ consensus estimates.
Is now the time to buy Ross Stores? Find out by accessing our full research report, it’s free.
Ross Stores (ROST) Q2 CY2025 Highlights:
- Revenue: $5.53 billion vs analyst estimates of $5.54 billion (4.6% year-on-year growth, in line)
- EPS (GAAP): $1.56 vs analyst estimates of $1.54 (1.4% beat)
- Adjusted EBITDA: $808.6 million vs analyst estimates of $762.1 million (14.6% margin, 6.1% beat)
- EPS (GAAP) guidance for the full year is $6.15 at the midpoint, roughly in line with what analysts were expecting
- Operating Margin: 11.5%, in line with the same quarter last year
- Free Cash Flow Margin: 8.4%, similar to the same quarter last year
- Locations: 2,233 at quarter end, up from 2,148 in the same quarter last year
- Same-Store Sales rose 2% year on year (4% in the same quarter last year)
- Market Capitalization: $47.87 billion
Company Overview
Selling excess inventory or overstocked items from other retailers, Ross Stores (NASDAQ: ROST) is an off-price concept that sells apparel and other goods at prices much lower than department stores.
Revenue Growth
A company’s long-term sales performance is one signal of its overall quality. Any business can experience short-term success, but top-performing ones enjoy sustained growth for years.
With $21.5 billion in revenue over the past 12 months, Ross Stores is one of the larger companies in the consumer retail industry and benefits from a well-known brand that influences purchasing decisions. However, its scale is a double-edged sword because there is only so much real estate to build new stores, placing a ceiling on its growth. To accelerate sales, Ross Stores likely needs to optimize its pricing or lean into international expansion.
As you can see below, Ross Stores’s 5.7% annualized revenue growth over the last six years (we compare to 2019 to normalize for COVID-19 impacts) was tepid, but to its credit, it opened new stores and increased sales at existing, established locations.
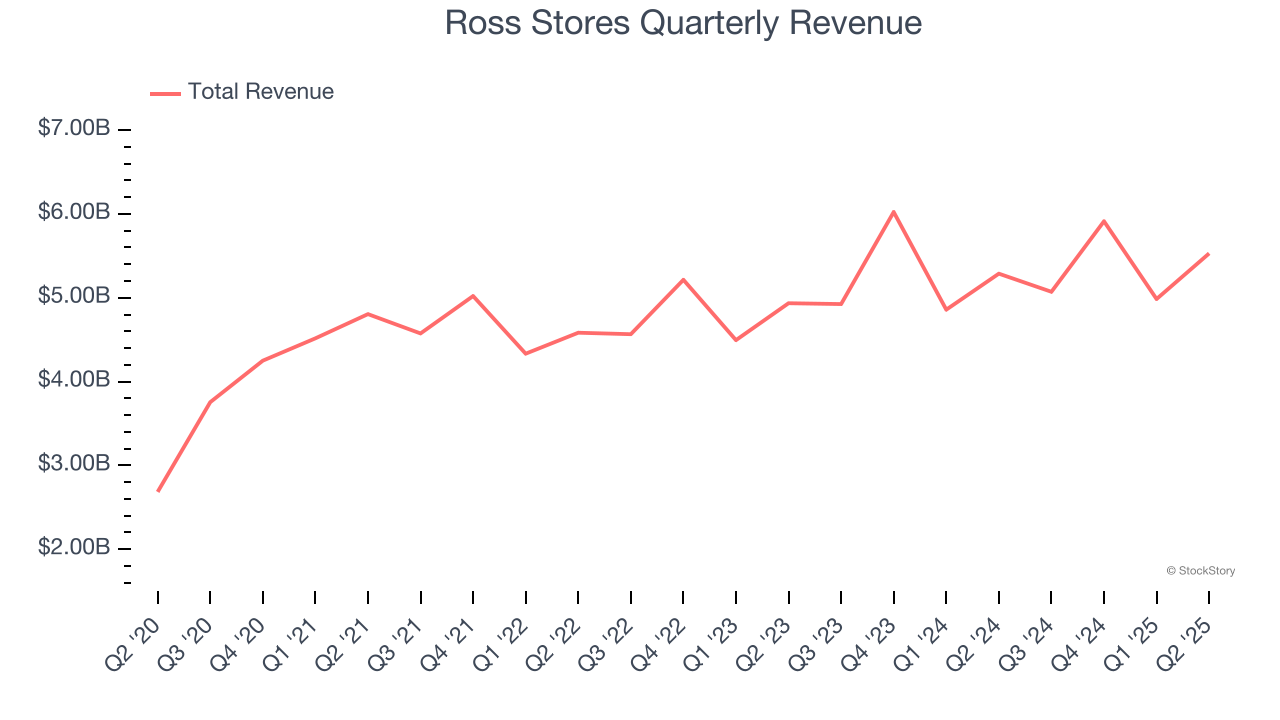
This quarter, Ross Stores grew its revenue by 4.6% year on year, and its $5.53 billion of revenue was in line with Wall Street’s estimates.
Looking ahead, sell-side analysts expect revenue to grow 4.4% over the next 12 months, similar to its six-year rate. We still think its growth trajectory is satisfactory given its scale and suggests the market is baking in success for its products.
Today’s young investors won’t have read the timeless lessons in Gorilla Game: Picking Winners In High Technology because it was written more than 20 years ago when Microsoft and Apple were first establishing their supremacy. But if we apply the same principles, then enterprise software stocks leveraging their own generative AI capabilities may well be the Gorillas of the future. So, in that spirit, we are excited to present our Special Free Report on a profitable, fast-growing enterprise software stock that is already riding the automation wave and looking to catch the generative AI next.
Store Performance
Number of Stores
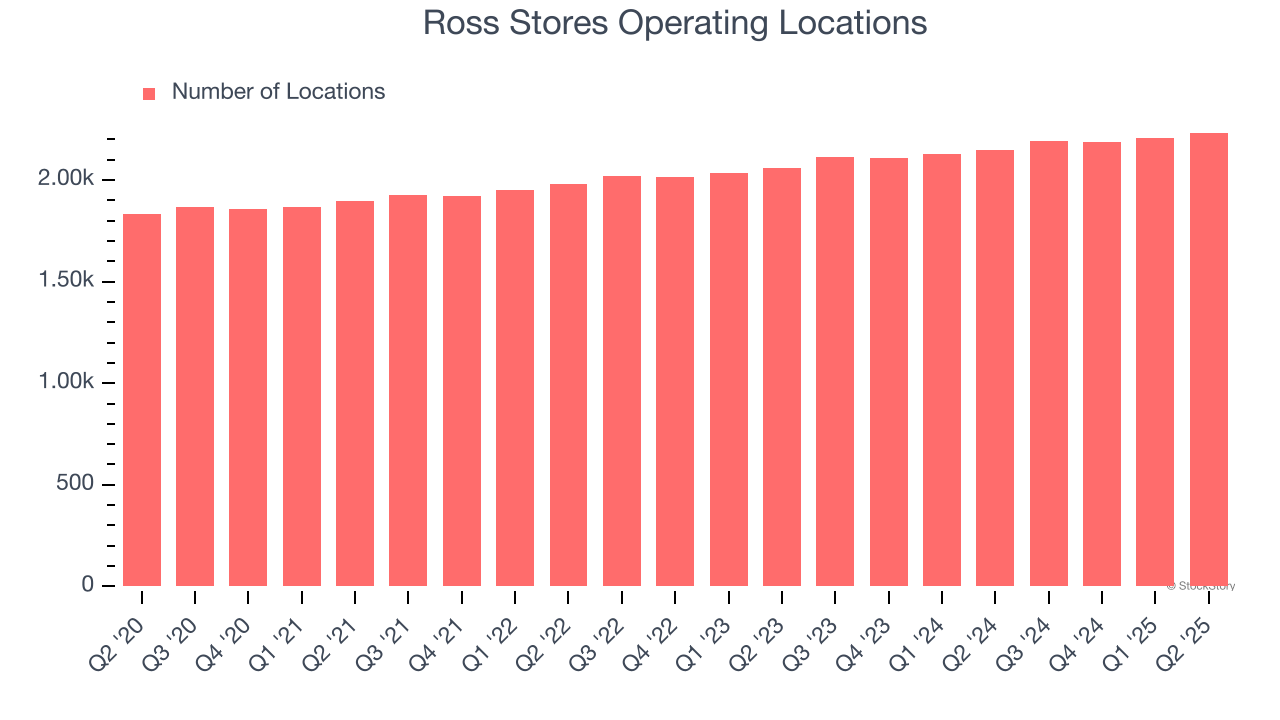
A retailer’s store count often determines how much revenue it can generate.
Ross Stores operated 2,233 locations in the latest quarter. It has opened new stores at a rapid clip over the last two years, averaging 4.1% annual growth, much faster than the broader consumer retail sector.
When a retailer opens new stores, it usually means it’s investing for growth because demand is greater than supply, especially in areas where consumers may not have a store within reasonable driving distance.
Same-Store Sales
The change in a company's store base only tells one side of the story. The other is the performance of its existing locations and e-commerce sales, which informs management teams whether they should expand or downsize their physical footprints. Same-store sales provides a deeper understanding of this issue because it measures organic growth at brick-and-mortar shops for at least a year.
Ross Stores’s demand has been healthy for a retailer over the last two years. On average, the company has grown its same-store sales by a robust 3.1% per year. This performance suggests its rollout of new stores could be beneficial for shareholders. When a retailer has demand, more locations should help it reach more customers and boost revenue growth.
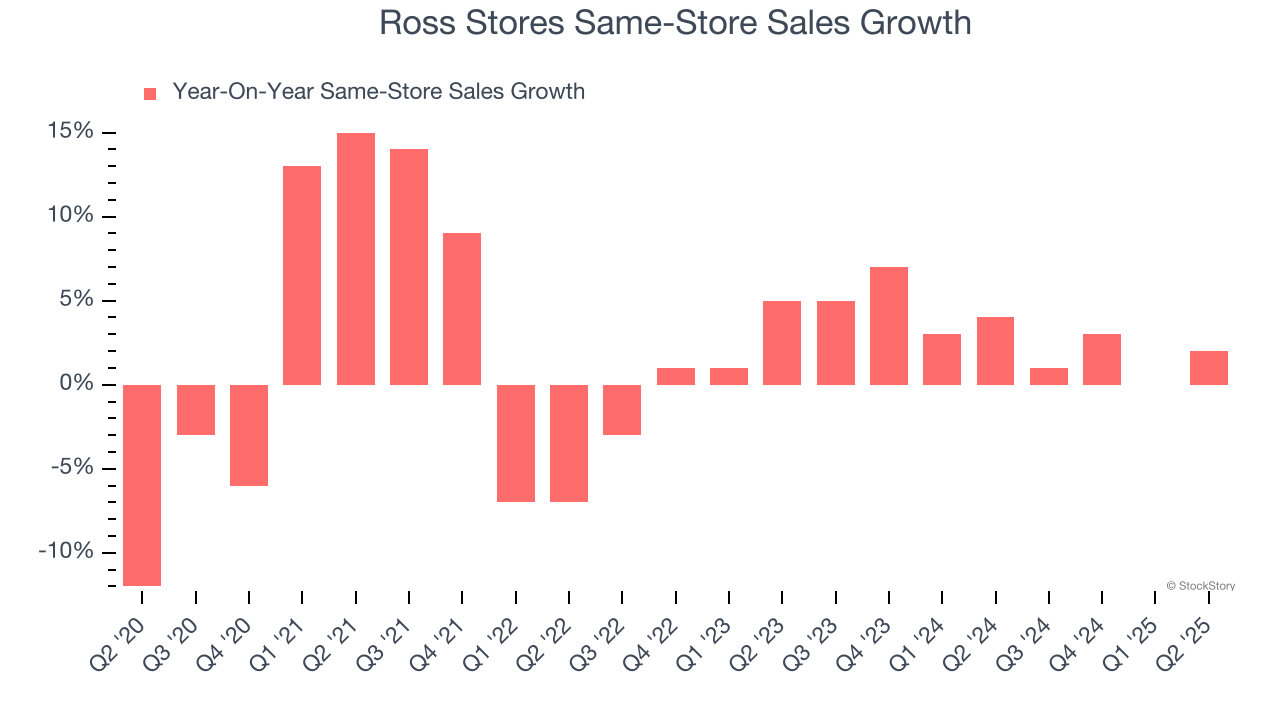
In the latest quarter, Ross Stores’s same-store sales rose 2% year on year. This growth was a deceleration from its historical levels, showing the business is still performing well but losing a bit of steam.
Key Takeaways from Ross Stores’s Q2 Results
We were impressed by Ross Stores’s optimistic EPS guidance for next quarter, which blew past analysts’ expectations. We were also glad its EBITDA outperformed Wall Street’s estimates. Overall, we think this was a decent quarter with some key metrics above expectations. The stock traded up 2.5% to $149.25 immediately following the results.
Ross Stores may have had a good quarter, but does that mean you should invest right now? We think that the latest quarter is only one piece of the longer-term business quality puzzle. Quality, when combined with valuation, can help determine if the stock is a buy. We cover that in our actionable full research report which you can read here, it’s free.