Retail behemoth Walmart (NYSE: WMT) beat Wall Street’s revenue expectations in Q2 CY2025, with sales up 4.8% year on year to $177.4 billion. The company expects next quarter’s revenue to be around $176.8 billion, close to analysts’ estimates. Its non-GAAP profit of $0.68 per share was 7.9% below analysts’ consensus estimates.
Is now the time to buy Walmart? Find out by accessing our full research report, it’s free.
Walmart (WMT) Q2 CY2025 Highlights:
- Revenue: $177.4 billion vs analyst estimates of $176 billion (4.8% year-on-year growth, 0.8% beat)
- Adjusted EPS: $0.68 vs analyst expectations of $0.74 (7.9% miss)
- Adjusted EBITDA: $10.77 billion vs analyst estimates of $12.05 billion (6.1% margin, 10.6% miss)
- Revenue Guidance for Q3 CY2025 is $176.8 billion at the midpoint, roughly in line with what analysts were expecting
- Management slightly raised its full-year Adjusted EPS guidance to $2.57 at the midpoint
- Operating Margin: 4.1%, in line with the same quarter last year
- Free Cash Flow Margin: 3.7%, similar to the same quarter last year
- Same-Store Sales rose 4.6% year on year, in line with the same quarter last year
- Market Capitalization: $818.6 billion
Company Overview
Known for its large-format Supercenters, Walmart (NYSE: WMT) is a retail pioneer that serves a budget-conscious consumer who is looking for a wide range of products under one roof.
Revenue Growth
Reviewing a company’s long-term sales performance reveals insights into its quality. Any business can experience short-term success, but top-performing ones enjoy sustained growth for years.
With $693.2 billion in revenue over the past 12 months, Walmart is a behemoth in the consumer retail sector and benefits from economies of scale, giving it an edge in distribution. This also enables it to gain more leverage on its fixed costs than smaller competitors and the flexibility to offer lower prices. However, its scale is a double-edged sword because it’s harder to find incremental growth when you’ve penetrated most of the market. To accelerate sales, Walmart likely needs to optimize its pricing or lean into international expansion.
As you can see below, Walmart’s sales grew at a sluggish 5% compounded annual growth rate over the last six years (we compare to 2019 to normalize for COVID-19 impacts) as its store footprint remained unchanged.
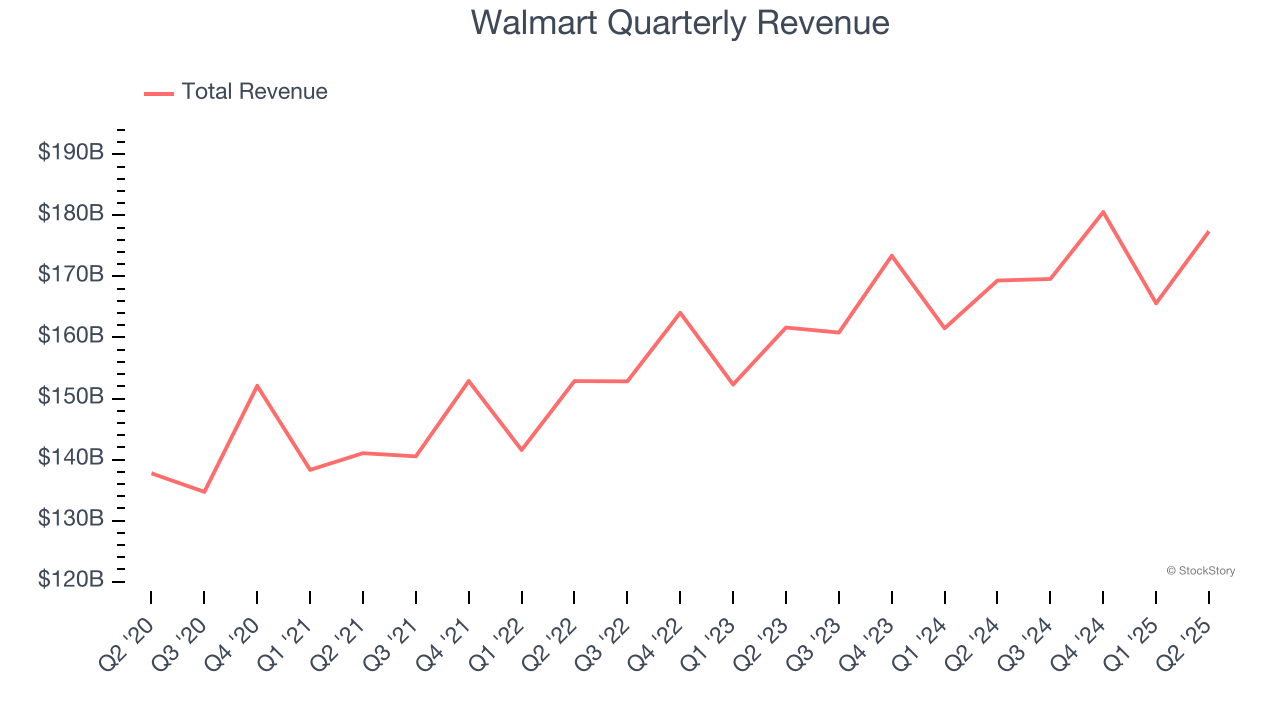
This quarter, Walmart reported modest year-on-year revenue growth of 4.8% but beat Wall Street’s estimates by 0.8%. Company management is currently guiding for a 4.3% year-on-year increase in sales next quarter.
Looking further ahead, sell-side analysts expect revenue to grow 4.2% over the next 12 months, similar to its six-year rate. This projection is above average for the sector and implies its newer products will help maintain its historical top-line performance.
Unless you’ve been living under a rock, it should be obvious by now that generative AI is going to have a huge impact on how large corporations do business. While Nvidia and AMD are trading close to all-time highs, we prefer a lesser-known (but still profitable) stock benefiting from the rise of AI. Click here to access our free report one of our favorites growth stories.
Store Performance
Number of Stores
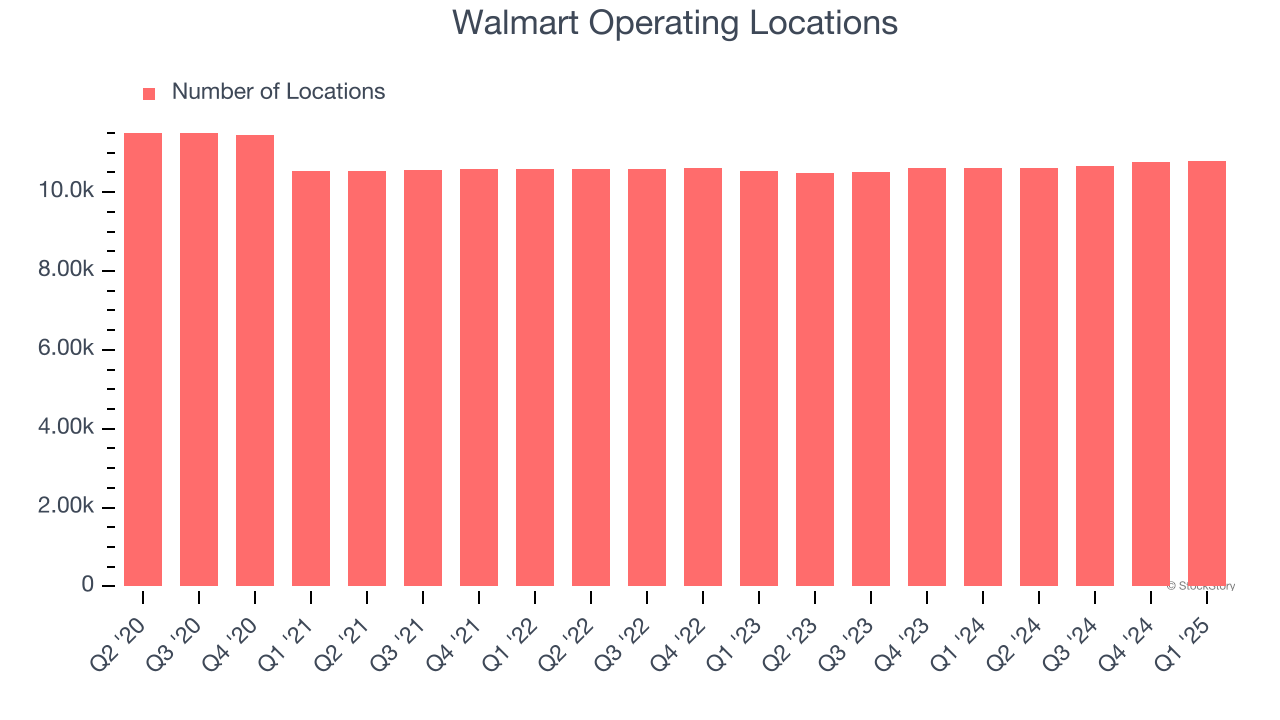
A retailer’s store count often determines how much revenue it can generate.
Over the last two years, Walmart has kept its store count flat while other consumer retail businesses have opted for growth.
When a retailer keeps its store footprint steady, it usually means demand is stable and it’s focusing on operational efficiency to increase profitability.
Note that Walmart reports its store count intermittently, so some data points are missing in the chart below.
Same-Store Sales
A company's store base only paints one part of the picture. When demand is high, it makes sense to open more. But when demand is low, it’s prudent to close some locations and use the money in other ways. Same-store sales provides a deeper understanding of this issue because it measures organic growth at brick-and-mortar shops for at least a year.
Walmart has been one of the most successful retailers over the last two years thanks to skyrocketing demand within its existing locations. On average, the company has posted exceptional year-on-year same-store sales growth of 4.6%. Given its flat store base over the same period, this performance stems from not only increased foot traffic at existing locations but also higher e-commerce sales as demand shifts from in-store to online.
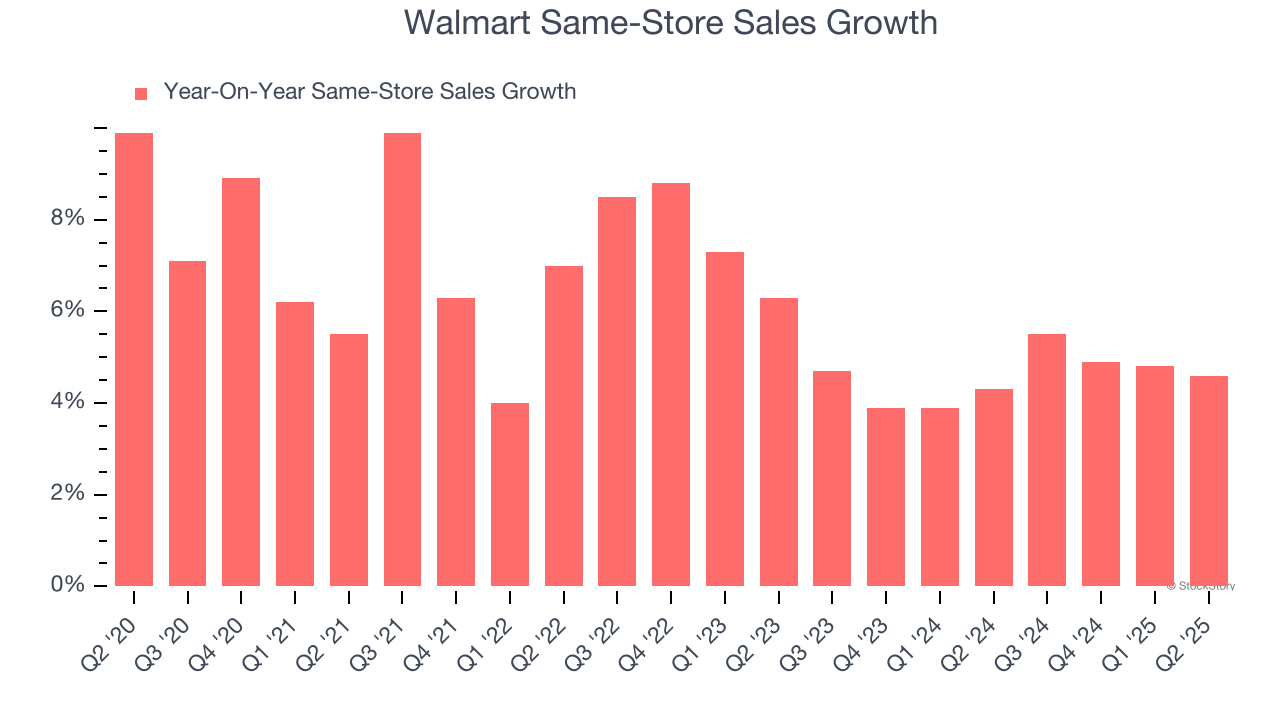
In the latest quarter, Walmart’s same-store sales rose 4.6% year on year. This performance was more or less in line with its historical levels.
Key Takeaways from Walmart’s Q2 Results
Walmart’s revenue narrowly outperformed Wall Street’s estimates. Looking ahead, the company raised full year sales and earnings guidance. Overall, this was a decent quarter with no big surprises.
Walmart didn’t show it’s best hand this quarter, but does that create an opportunity to buy the stock right now? We think that the latest quarter is only one piece of the longer-term business quality puzzle. Quality, when combined with valuation, can help determine if the stock is a buy. We cover that in our actionable full research report which you can read here, it’s free.