Membership-only discount retailer BJ’s Wholesale Club (NYSE: BJ) missed Wall Street’s revenue expectations in Q2 CY2025 as sales rose 3.4% year on year to $5.38 billion. Its non-GAAP profit of $1.14 per share was 4.4% above analysts’ consensus estimates.
Is now the time to buy BJ's? Find out by accessing our full research report, it’s free.
BJ's (BJ) Q2 CY2025 Highlights:
- Revenue: $5.38 billion vs analyst estimates of $5.49 billion (3.4% year-on-year growth, 1.9% miss)
- Adjusted EPS: $1.14 vs analyst estimates of $1.09 (4.4% beat)
- Adjusted EBITDA: $303.9 million vs analyst estimates of $291.3 million (5.6% margin, 4.3% beat)
- Management raised its full-year Adjusted EPS guidance to $4.28 at the midpoint, a 1.8% increase
- Operating Margin: 4%, in line with the same quarter last year
- Free Cash Flow Margin: 1.6%, similar to the same quarter last year
- Locations: 255 at quarter end, up from 244 in the same quarter last year
- Same-Store Sales were flat year on year (3.1% in the same quarter last year)
- Market Capitalization: $14.02 billion
Company Overview
Appealing to the budget-conscious individual shopping for a household, BJ’s Wholesale Club (NYSE: BJ) is a membership-only retail chain that sells groceries, appliances, electronics, and household items, often in bulk quantities.
Revenue Growth
Reviewing a company’s long-term sales performance reveals insights into its quality. Any business can put up a good quarter or two, but the best consistently grow over the long haul.
With $20.91 billion in revenue over the past 12 months, BJ's is one of the larger companies in the consumer retail industry and benefits from a well-known brand that influences purchasing decisions. However, its scale is a double-edged sword because there is only so much real estate to build new stores, placing a ceiling on its growth. To accelerate sales, BJ's likely needs to optimize its pricing or lean into international expansion.
As you can see below, BJ’s sales grew at a mediocre 8.1% compounded annual growth rate over the last six years (we compare to 2019 to normalize for COVID-19 impacts) as it barely increased sales at existing, established locations.
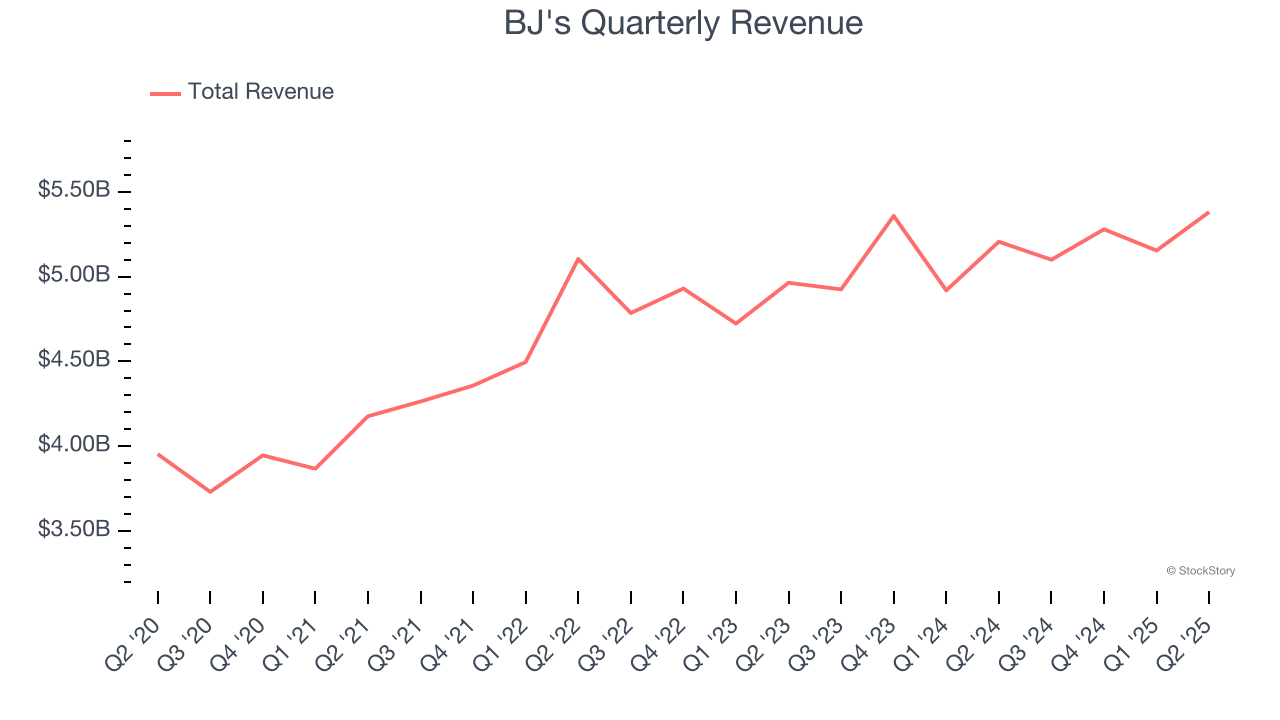
This quarter, BJ’s revenue grew by 3.4% year on year to $5.38 billion, falling short of Wall Street’s estimates.
Looking ahead, sell-side analysts expect revenue to grow 7% over the next 12 months, similar to its six-year rate. We still think its growth trajectory is attractive given its scale and indicates the market is forecasting success for its products.
Software is eating the world and there is virtually no industry left that has been untouched by it. That drives increasing demand for tools helping software developers do their jobs, whether it be monitoring critical cloud infrastructure, integrating audio and video functionality, or ensuring smooth content streaming. Click here to access a free report on our 3 favorite stocks to play this generational megatrend.
Store Performance
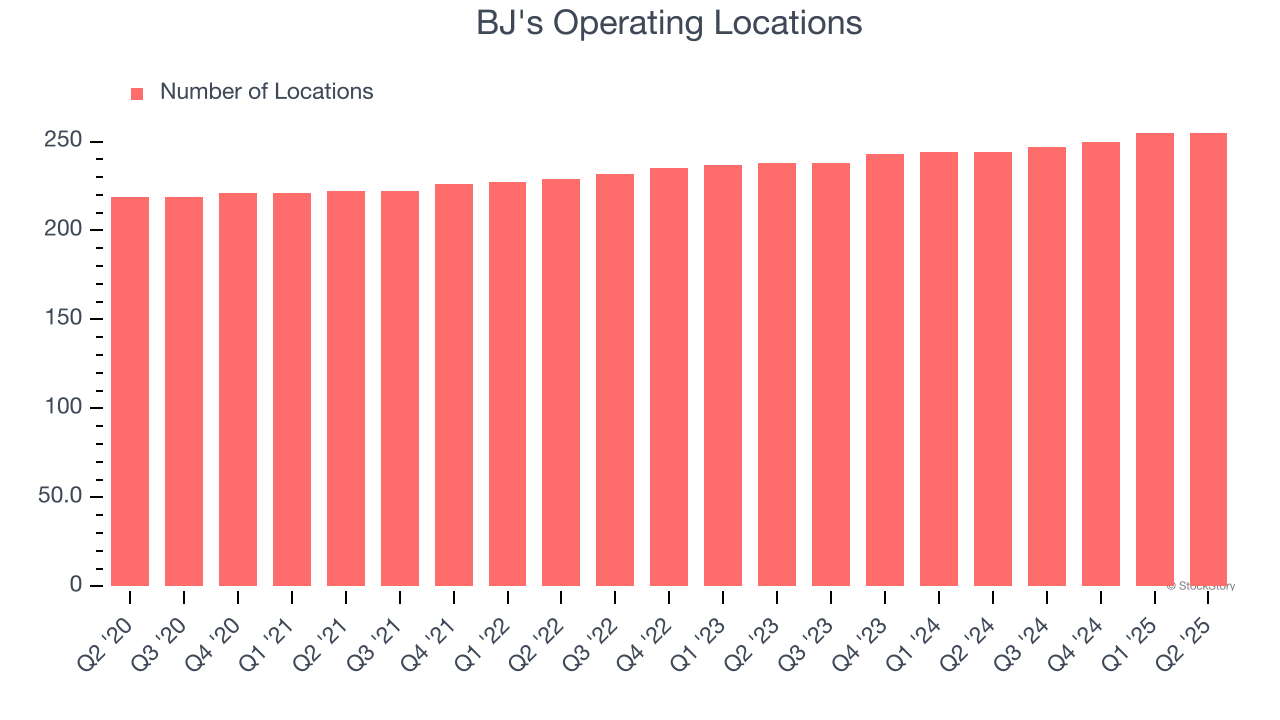
Number of Stores
A retailer’s store count often determines how much revenue it can generate.
BJ's sported 255 locations in the latest quarter. Over the last two years, it has opened new stores quickly, averaging 3.4% annual growth. This was faster than the broader consumer retail sector.
When a retailer opens new stores, it usually means it’s investing for growth because demand is greater than supply, especially in areas where consumers may not have a store within reasonable driving distance.
Same-Store Sales
The change in a company's store base only tells one side of the story. The other is the performance of its existing locations and e-commerce sales, which informs management teams whether they should expand or downsize their physical footprints. Same-store sales provides a deeper understanding of this issue because it measures organic growth at brick-and-mortar shops for at least a year.
BJ’s demand within its existing locations has been relatively stable over the last two years but was below most retailers. On average, the company’s same-store sales have grown by 1.5% per year. This performance suggests it should consider improving its foot traffic and efficiency before expanding its store base.
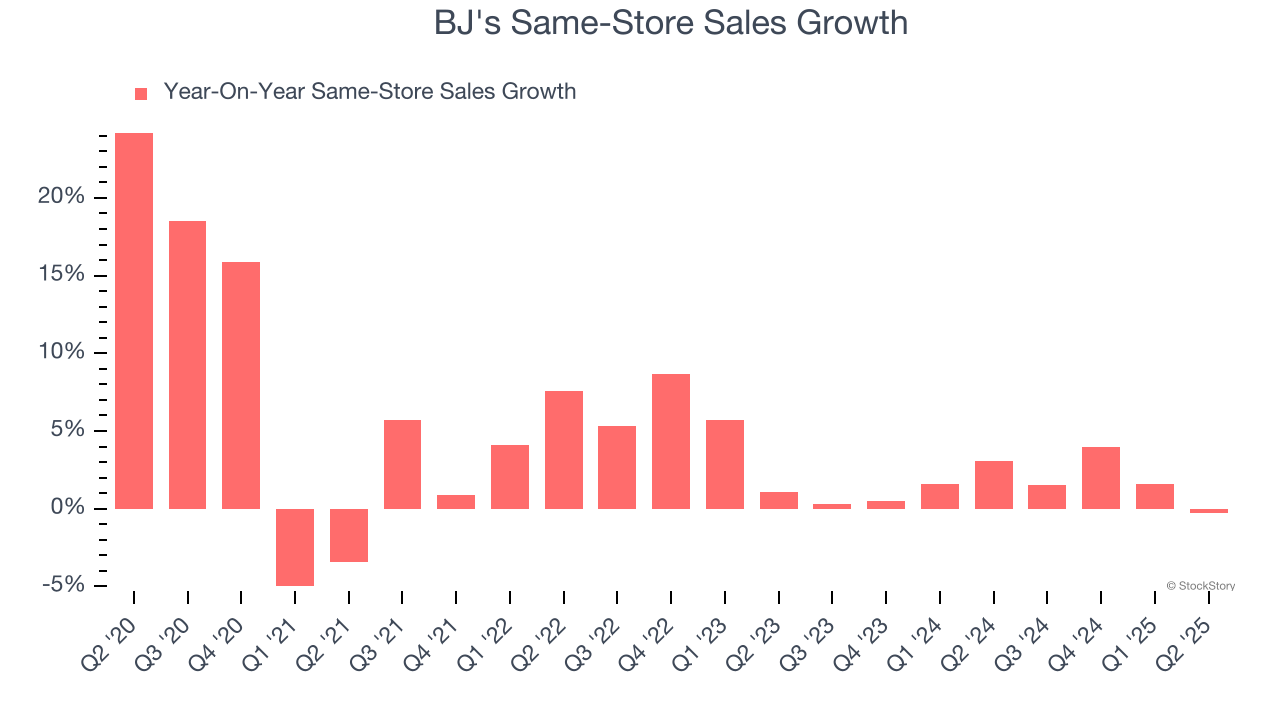
In the latest quarter, BJ’s year on year same-store sales were flat. This was a meaningful deceleration from its historical levels. We’ll be watching closely to see if BJ's can reaccelerate growth.
Key Takeaways from BJ’s Q2 Results
We enjoyed seeing BJ's beat analysts’ EBITDA expectations this quarter. We were also happy its gross margin narrowly outperformed Wall Street’s estimates. On the other hand, its revenue missed and its full-year EPS guidance fell slightly short of Wall Street’s estimates. Zooming out, we think this was a mixed quarter. The stock traded up 1.7% to $108 immediately following the results.
Big picture, is BJ's a buy here and now? We think that the latest quarter is only one piece of the longer-term business quality puzzle. Quality, when combined with valuation, can help determine if the stock is a buy. We cover that in our actionable full research report which you can read here, it’s free.