Gorman-Rupp trades at $42.65 and has moved in lockstep with the market. Its shares have returned 10% over the last six months while the S&P 500 has gained 8.6%.
Is now the time to buy Gorman-Rupp, or should you be careful about including it in your portfolio? Get the full stock story straight from our expert analysts, it’s free.
Why Is Gorman-Rupp Not Exciting?
We're swiping left on Gorman-Rupp for now. Here are three reasons you should be careful with GRC and a stock we'd rather own.
1. Lackluster Revenue Growth
Long-term growth is the most important, but within industrials, a stretched historical view may miss new industry trends or demand cycles. Gorman-Rupp’s recent performance shows its demand has slowed significantly as its annualized revenue growth of 3.3% over the last two years was well below its five-year trend. 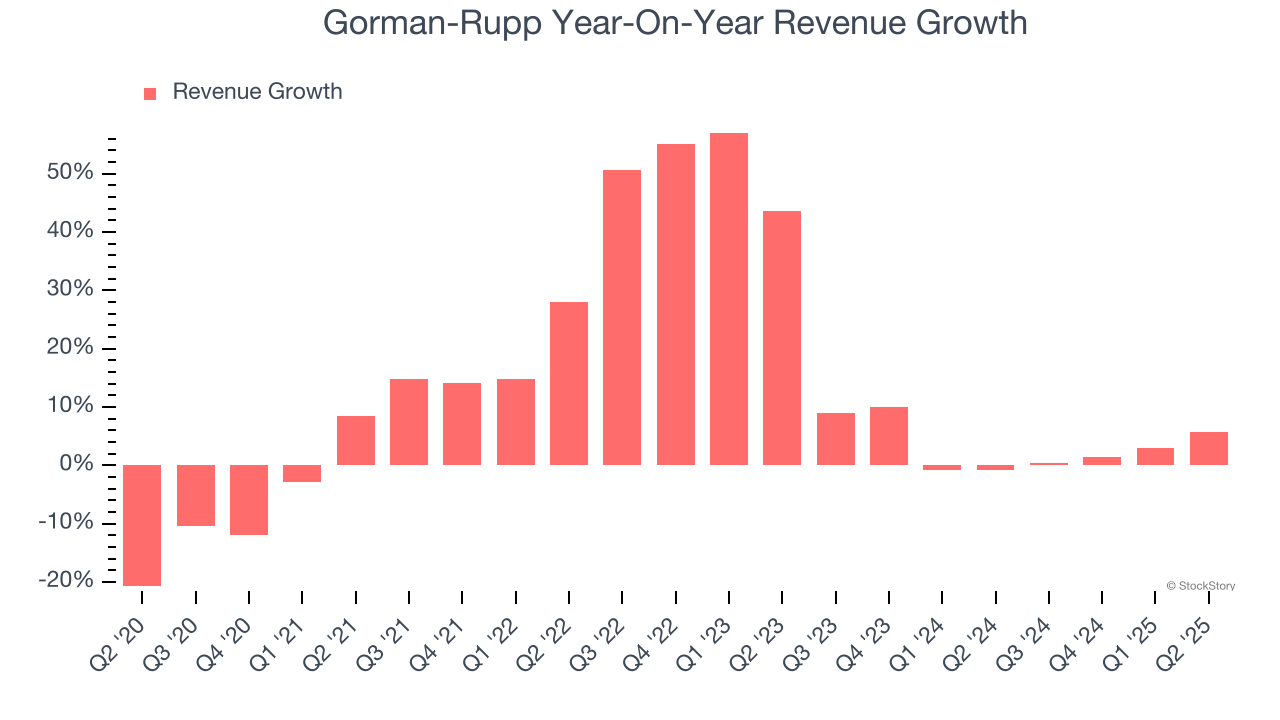
2. Projected Revenue Growth Is Slim
Forecasted revenues by Wall Street analysts signal a company’s potential. Predictions may not always be accurate, but accelerating growth typically boosts valuation multiples and stock prices while slowing growth does the opposite.
Over the next 12 months, sell-side analysts expect Gorman-Rupp’s revenue to rise by 3.7%, close to its 12.7% annualized growth for the past five years. This projection doesn't excite us and implies its newer products and services will not accelerate its top-line performance yet.
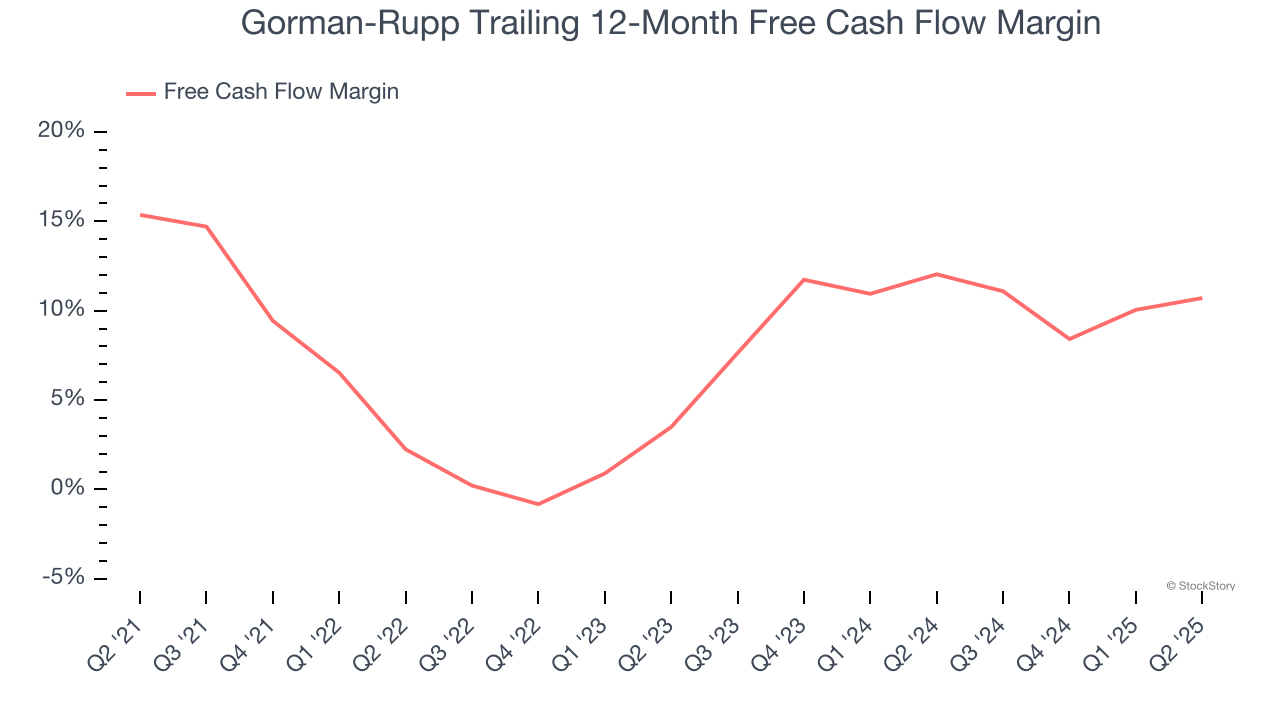
3. Free Cash Flow Margin Dropping
Free cash flow isn't a prominently featured metric in company financials and earnings releases, but we think it's telling because it accounts for all operating and capital expenses, making it tough to manipulate. Cash is king.
As you can see below, Gorman-Rupp’s margin dropped by 4.7 percentage points over the last five years. If its declines continue, it could signal increasing investment needs and capital intensity. Gorman-Rupp’s free cash flow margin for the trailing 12 months was 10.7%.
Final Judgment
Gorman-Rupp isn’t a terrible business, but it isn’t one of our picks. That said, the stock currently trades at 19.2× forward P/E (or $42.65 per share). This valuation multiple is fair, but we don’t have much faith in the company. We're fairly confident there are better investments elsewhere. Let us point you toward a fast-growing restaurant franchise with an A+ ranch dressing sauce.
Stocks We Would Buy Instead of Gorman-Rupp
Donald Trump’s April 2025 "Liberation Day" tariffs sent markets into a tailspin, but stocks have since rebounded strongly, proving that knee-jerk reactions often create the best buying opportunities.
The smart money is already positioning for the next leg up. Don’t miss out on the recovery - check out our Top 6 Stocks for this week. This is a curated list of our High Quality stocks that have generated a market-beating return of 183% over the last five years (as of March 31st 2025).
Stocks that made our list in 2020 include now familiar names such as Nvidia (+1,545% between March 2020 and March 2025) as well as under-the-radar businesses like the once-small-cap company Exlservice (+354% five-year return). Find your next big winner with StockStory today.
StockStory is growing and hiring equity analyst and marketing roles. Are you a 0 to 1 builder passionate about the markets and AI? See the open roles here.