
Cushman & Wakefield has had an impressive run over the past six months as its shares have beaten the S&P 500 by 22.8%. The stock now trades at $15.58, marking a 31.4% gain. This was partly due to its solid quarterly results, and the run-up might have investors contemplating their next move.
Is there a buying opportunity in Cushman & Wakefield, or does it present a risk to your portfolio? Get the full breakdown from our expert analysts, it’s free.
Why Do We Think Cushman & Wakefield Will Underperform?
Despite the momentum, we're sitting this one out for now. Here are three reasons you should be careful with CWK and a stock we'd rather own.
1. Long-Term Revenue Growth Disappoints
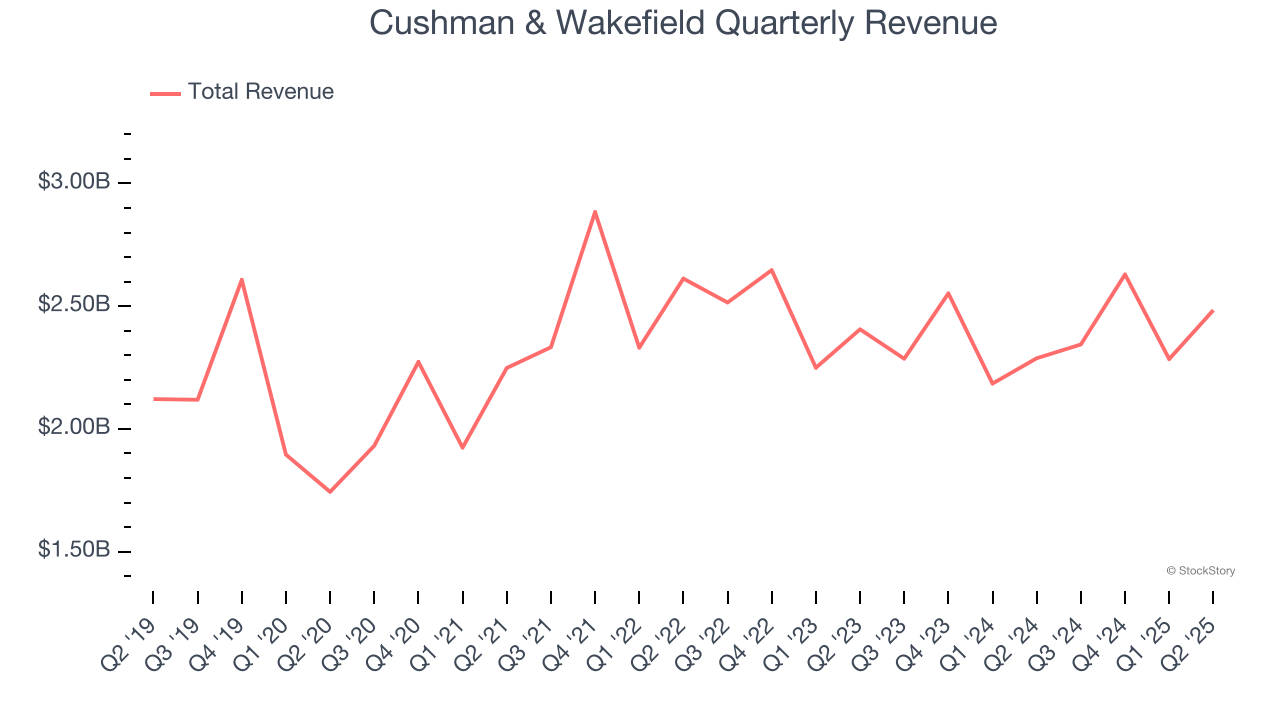
A company’s long-term sales performance can indicate its overall quality. Any business can put up a good quarter or two, but many enduring ones grow for years. Unfortunately, Cushman & Wakefield’s 3.1% annualized revenue growth over the last five years was sluggish. This was below our standard for the consumer discretionary sector.
2. EPS Trending Down
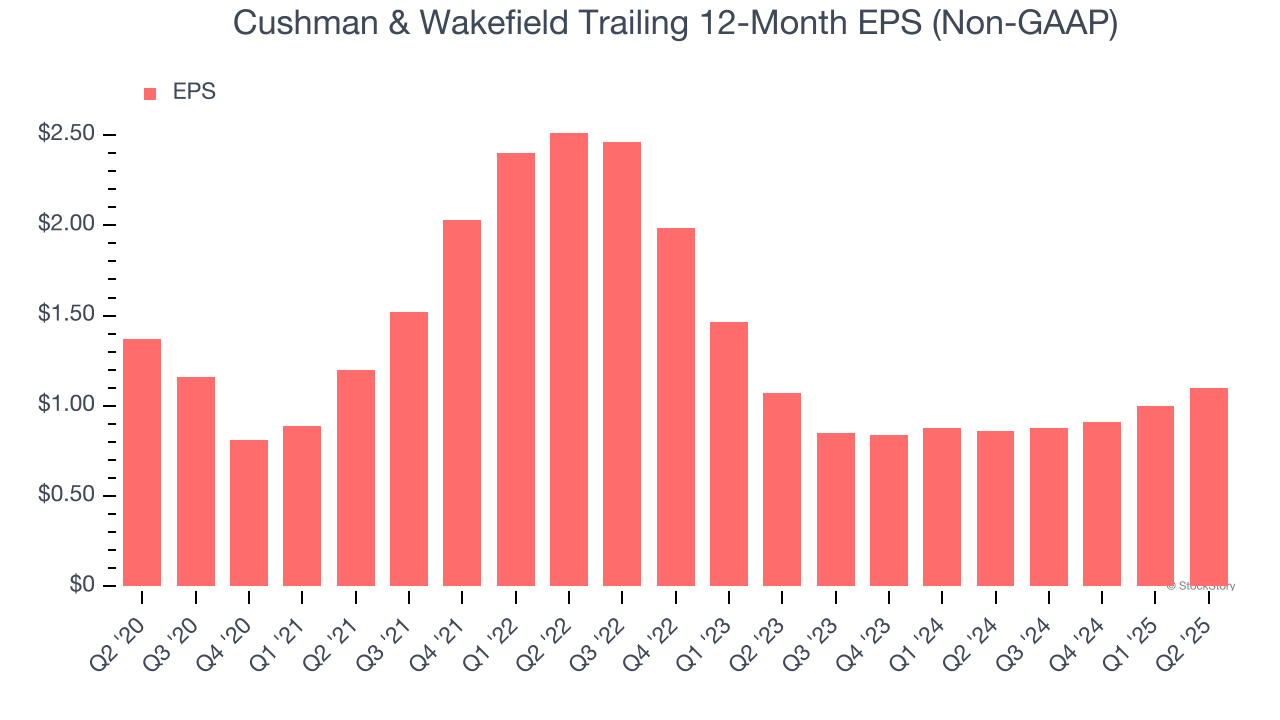
We track the long-term change in earnings per share (EPS) because it highlights whether a company’s growth is profitable.
Sadly for Cushman & Wakefield, its EPS declined by 4.3% annually over the last five years while its revenue grew by 3.1%. This tells us the company became less profitable on a per-share basis as it expanded.
3. Mediocre Free Cash Flow Margin Limits Reinvestment Potential
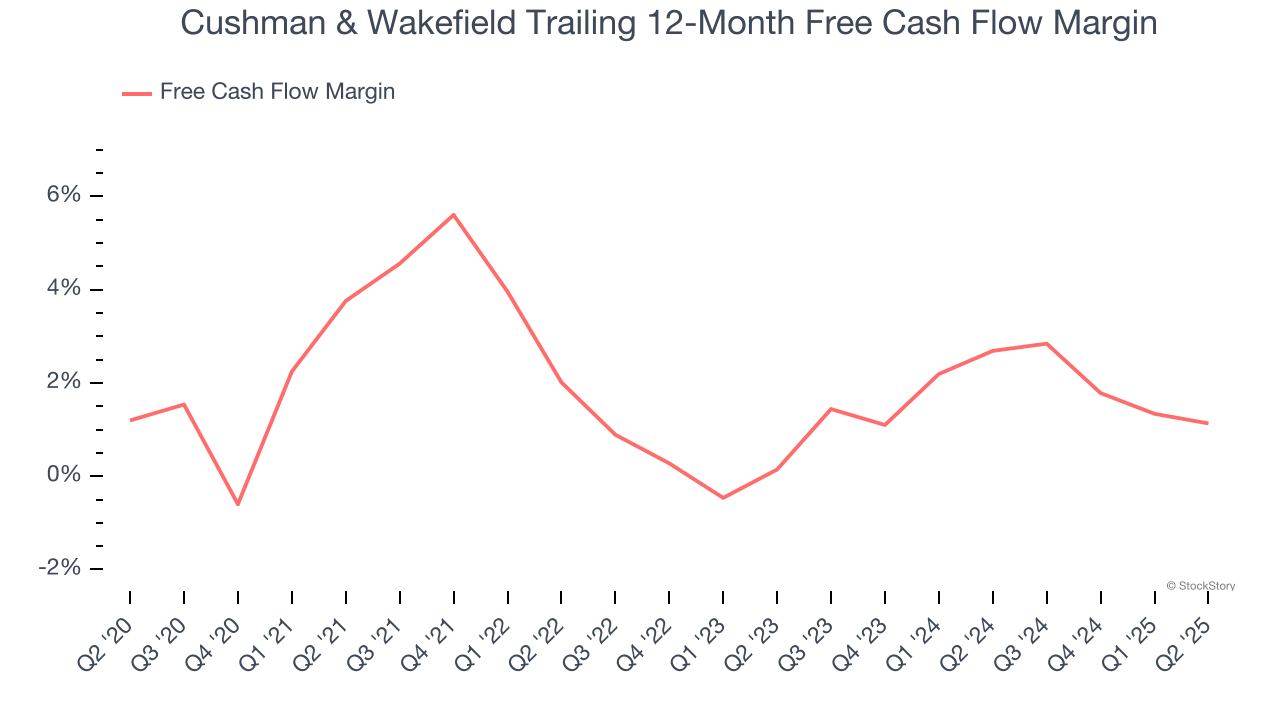
Free cash flow isn't a prominently featured metric in company financials and earnings releases, but we think it's telling because it accounts for all operating and capital expenses, making it tough to manipulate. Cash is king.
Cushman & Wakefield has shown poor cash profitability over the last two years, giving the company limited opportunities to return capital to shareholders. Its free cash flow margin averaged 1.9%, lousy for a consumer discretionary business.
Final Judgment
We cheer for all companies serving everyday consumers, but in the case of Cushman & Wakefield, we’ll be cheering from the sidelines. With its shares beating the market recently, the stock trades at 13× forward P/E (or $15.58 per share). This valuation is reasonable, but the company’s shaky fundamentals present too much downside risk. There are superior stocks to buy right now. We’d suggest looking at the most entrenched endpoint security platform on the market.
High-Quality Stocks for All Market Conditions
Donald Trump’s April 2025 "Liberation Day" tariffs sent markets into a tailspin, but stocks have since rebounded strongly, proving that knee-jerk reactions often create the best buying opportunities.
The smart money is already positioning for the next leg up. Don’t miss out on the recovery - check out our Top 6 Stocks for this week. This is a curated list of our High Quality stocks that have generated a market-beating return of 183% over the last five years (as of March 31st 2025).
Stocks that made our list in 2020 include now familiar names such as Nvidia (+1,545% between March 2020 and March 2025) as well as under-the-radar businesses like the once-micro-cap company Tecnoglass (+1,754% five-year return). Find your next big winner with StockStory today.
StockStory is growing and hiring equity analyst and marketing roles. Are you a 0 to 1 builder passionate about the markets and AI? See the open roles here.