
Footwear and apparel retailer Foot Locker (NYSE: FL) fell short of the market’s revenue expectations in Q2 CY2025, with sales falling 2.3% year on year to $1.86 billion. Its non-GAAP loss of $0.27 per share was significantly below analysts’ consensus estimates.
Is now the time to buy Foot Locker? Find out by accessing our full research report, it’s free.
Foot Locker (FL) Q2 CY2025 Highlights:
- Revenue: $1.86 billion vs analyst estimates of $1.87 billion (2.3% year-on-year decline, 0.6% miss)
- Adjusted EPS: -$0.27 vs analyst estimates of $0.10 (significant miss)
- Adjusted EBITDA: $32 million vs analyst estimates of $70.94 million (1.7% margin, 54.9% miss)
- Operating Margin: -1.4%, in line with the same quarter last year
- Free Cash Flow was -$44 million, down from $12 million in the same quarter last year
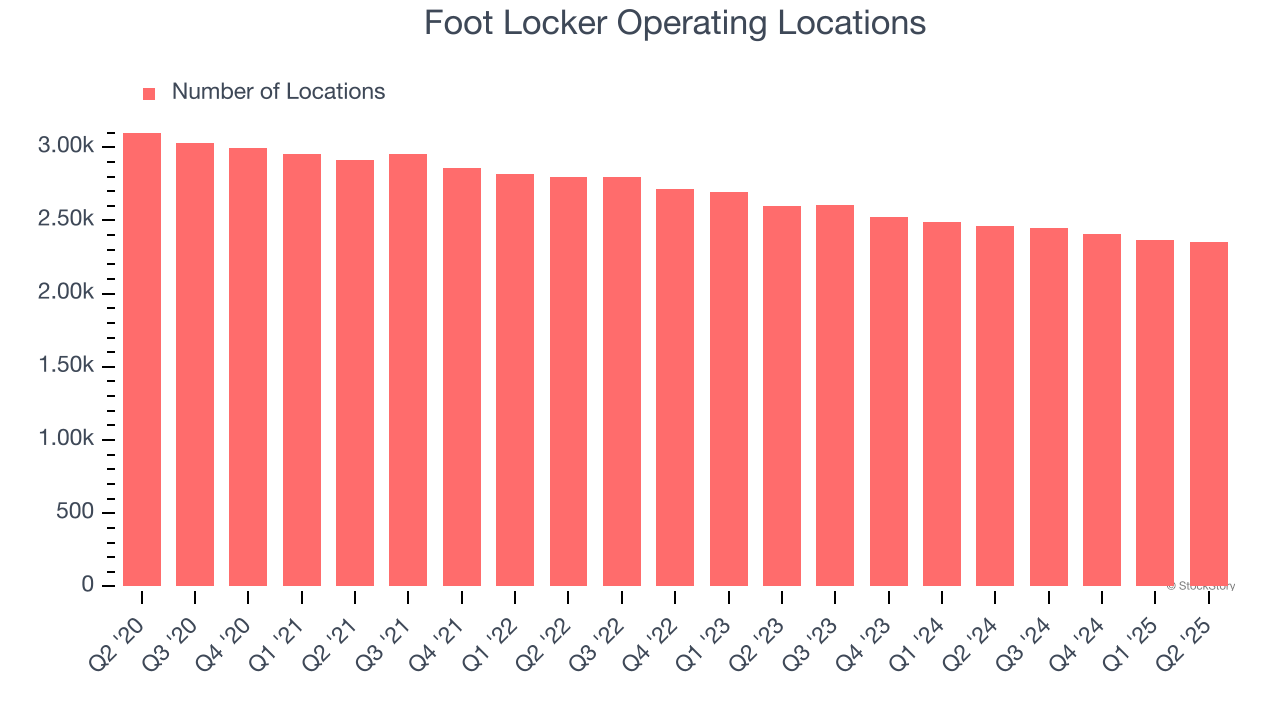
- Locations: 2,354 at quarter end, down from 2,464 in the same quarter last year
- Same-Store Sales fell 2% year on year (2.6% in the same quarter last year)
- Market Capitalization: $2.53 billion
Mary Dillon, Chief Executive Officer said, "In the second quarter, we built sequential momentum and delivered positive North American comparable sales results led by our Foot Locker, Kids Foot Locker, and Champs Sports banners, including a positive start to the Back-to-School season in July. At the same time, our results reflect a challenging operating environment and soft store traffic trends, particularly in our WSS and international businesses. Our team continued to execute our Lace Up Plan, remaining focused on elevating our customers' experiences by leveraging our strong brand partnerships, enhancing our store base through our Refresh and Reimagined programs, improving our digital platforms, and deepening global engagement through our FLX Rewards Program."
Company Overview
Known for store associates whose uniforms resemble those of referees, Foot Locker (NYSE: FL) is a specialty retailer that sells athletic footwear, clothing, and accessories.
Revenue Growth
Examining a company’s long-term performance can provide clues about its quality. Any business can put up a good quarter or two, but many enduring ones grow for years.
With $7.86 billion in revenue over the past 12 months, Foot Locker is a mid-sized retailer, which sometimes brings disadvantages compared to larger competitors benefiting from better economies of scale.
As you can see below, Foot Locker struggled to increase demand as its $7.86 billion of sales for the trailing 12 months was close to its revenue six years ago (we compare to 2019 to normalize for COVID-19 impacts). This was mainly because it closed stores.
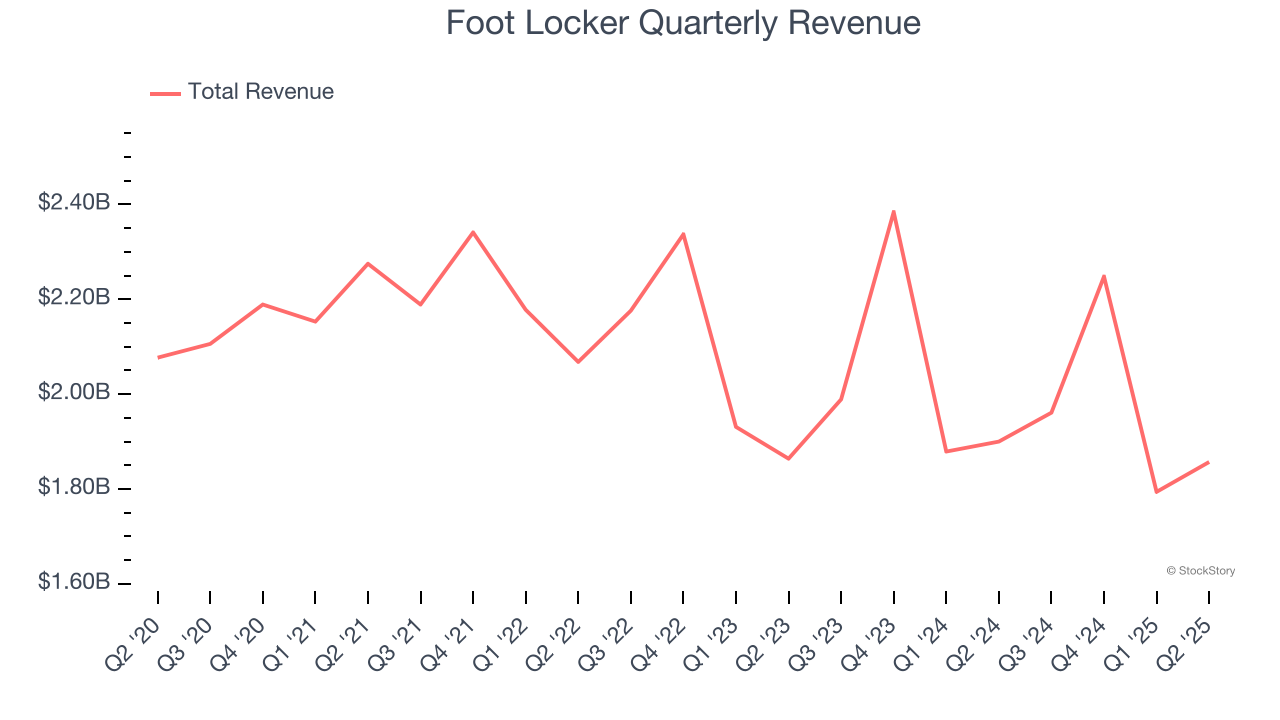
This quarter, Foot Locker missed Wall Street’s estimates and reported a rather uninspiring 2.3% year-on-year revenue decline, generating $1.86 billion of revenue.
Looking ahead, sell-side analysts expect revenue to remain flat over the next 12 months. This projection is underwhelming and indicates its newer products will not catalyze better top-line performance yet.
Here at StockStory, we certainly understand the potential of thematic investing. Diverse winners from Microsoft (MSFT) to Alphabet (GOOG), Coca-Cola (KO) to Monster Beverage (MNST) could all have been identified as promising growth stories with a megatrend driving the growth. So, in that spirit, we’ve identified a relatively under-the-radar profitable growth stock benefiting from the rise of AI, available to you FREE via this link.
Store Performance
Number of Stores
A retailer’s store count influences how much it can sell and how quickly revenue can grow.
Foot Locker operated 2,354 locations in the latest quarter. Over the last two years, the company has generally closed its stores, averaging 5.8% annual declines.
When a retailer shutters stores, it usually means that brick-and-mortar demand is less than supply, and it is responding by closing underperforming locations to improve profitability.
Same-Store Sales
A company's store base only paints one part of the picture. When demand is high, it makes sense to open more. But when demand is low, it’s prudent to close some locations and use the money in other ways. Same-store sales is an industry measure of whether revenue is growing at those existing stores and is driven by customer visits (often called traffic) and the average spending per customer (ticket).
Foot Locker’s demand within its existing locations has barely increased over the last two years as its same-store sales were flat. This performance isn’t ideal, and Foot Locker is attempting to boost same-store sales by closing stores (fewer locations sometimes lead to higher same-store sales).
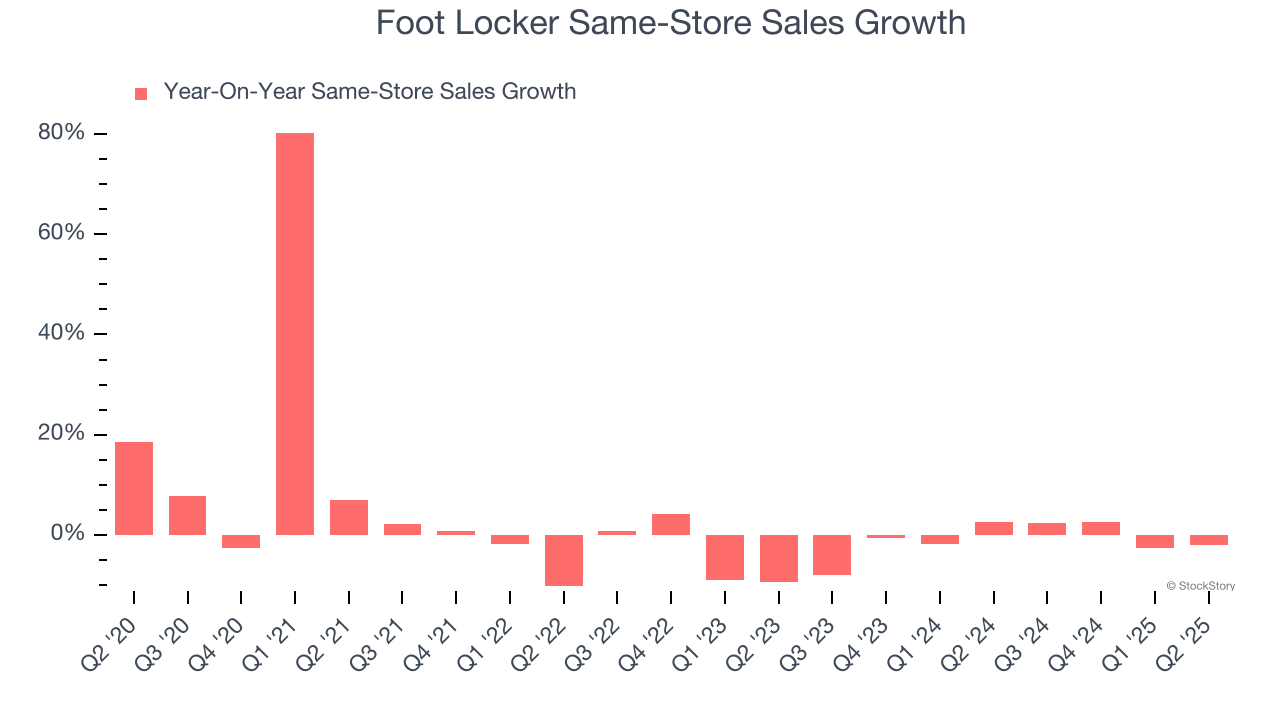
In the latest quarter, Foot Locker’s same-store sales fell by 2% year on year. This decrease represents a further deceleration from its historical levels. We hope the business can get back on track.
Key Takeaways from Foot Locker’s Q2 Results
We struggled to find many positives in these results. Its EBITDA missed and its gross margin fell short of Wall Street’s estimates. Overall, this quarter could have been better. The stock remained flat at $26.41 immediately following the results.
As previously announced on May 15, 2025, Foot Locker, Inc. and DICK'S Sporting Goods entered into a definitive merger agreement under which DICK'S will acquire the Company.
Foot Locker underperformed this quarter, but does that create an opportunity to invest right now? When making that decision, it’s important to consider its valuation, business qualities, as well as what has happened in the latest quarter. We cover that in our actionable full research report which you can read here, it’s free.


