
Over the past six months, Huron’s stock price fell to $136.57. Shareholders have lost 8.7% of their capital, which is disappointing considering the S&P 500 has climbed by 10.3%. This might have investors contemplating their next move.
Following the drawdown, is this a buying opportunity for HURN? Find out in our full research report, it’s free.
Why Is Huron a Good Business?
Founded in 2002 during a time of significant regulatory change in corporate America, Huron Consulting Group (NASDAQ: HURN) is a professional services company that helps organizations develop growth strategies, optimize operations, and implement digital transformation solutions.
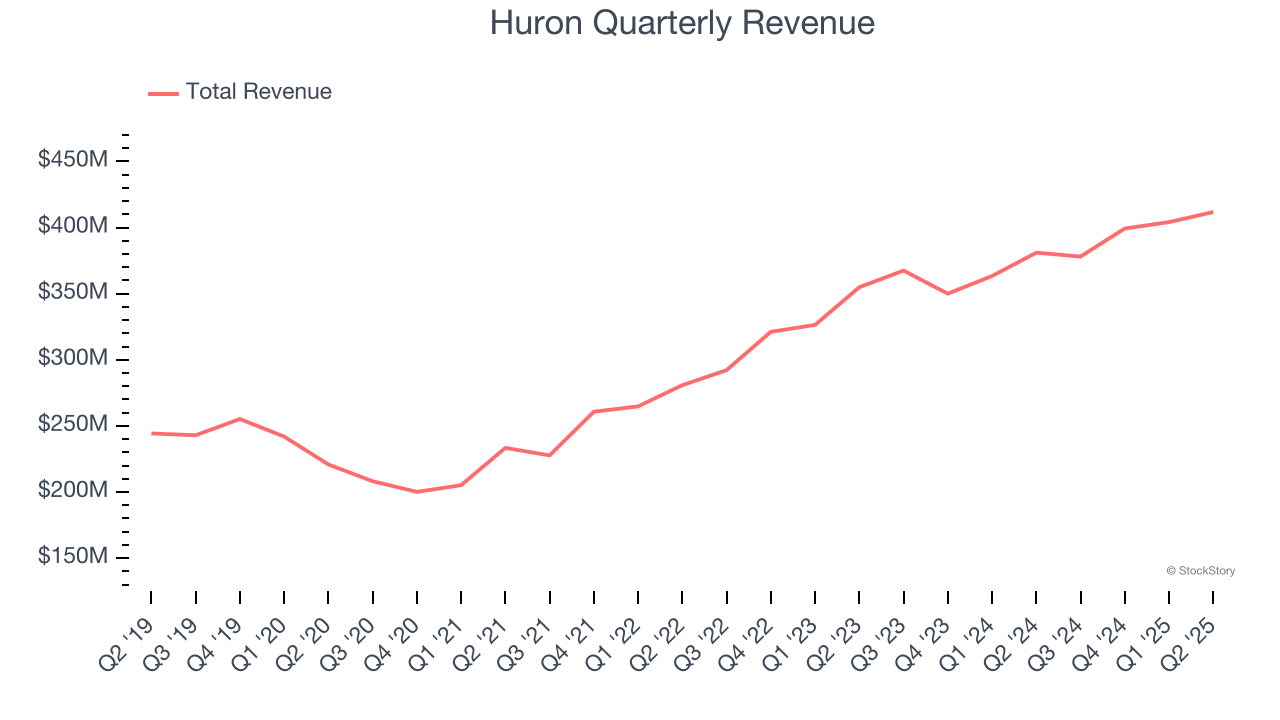
1. Skyrocketing Revenue Shows Strong Momentum
Reviewing a company’s long-term sales performance reveals insights into its quality. Any business can experience short-term success, but top-performing ones enjoy sustained growth for years. Luckily, Huron’s sales grew at an impressive 10.6% compounded annual growth rate over the last five years. Its growth beat the average business services company and shows its offerings resonate with customers.
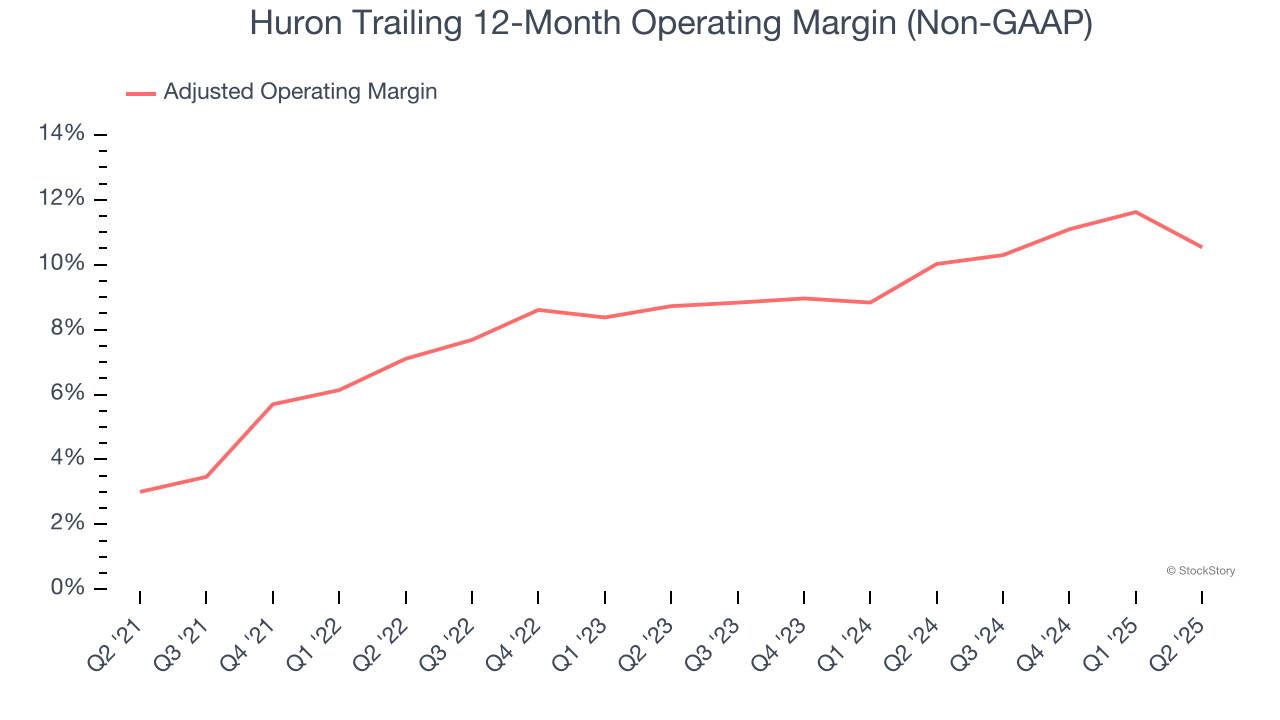
2. Adjusted Operating Margin Rising, Profits Up
Adjusted operating margin is one of the best measures of profitability because it tells us how much money a company takes home after subtracting all core expenses, like marketing and R&D. It also removes various one-time costs to paint a better picture of normalized profits.
Huron’s adjusted operating margin rose by 7.5 percentage points over the last five years, as its sales growth gave it immense operating leverage. Its adjusted operating margin for the trailing 12 months was 10.5%.
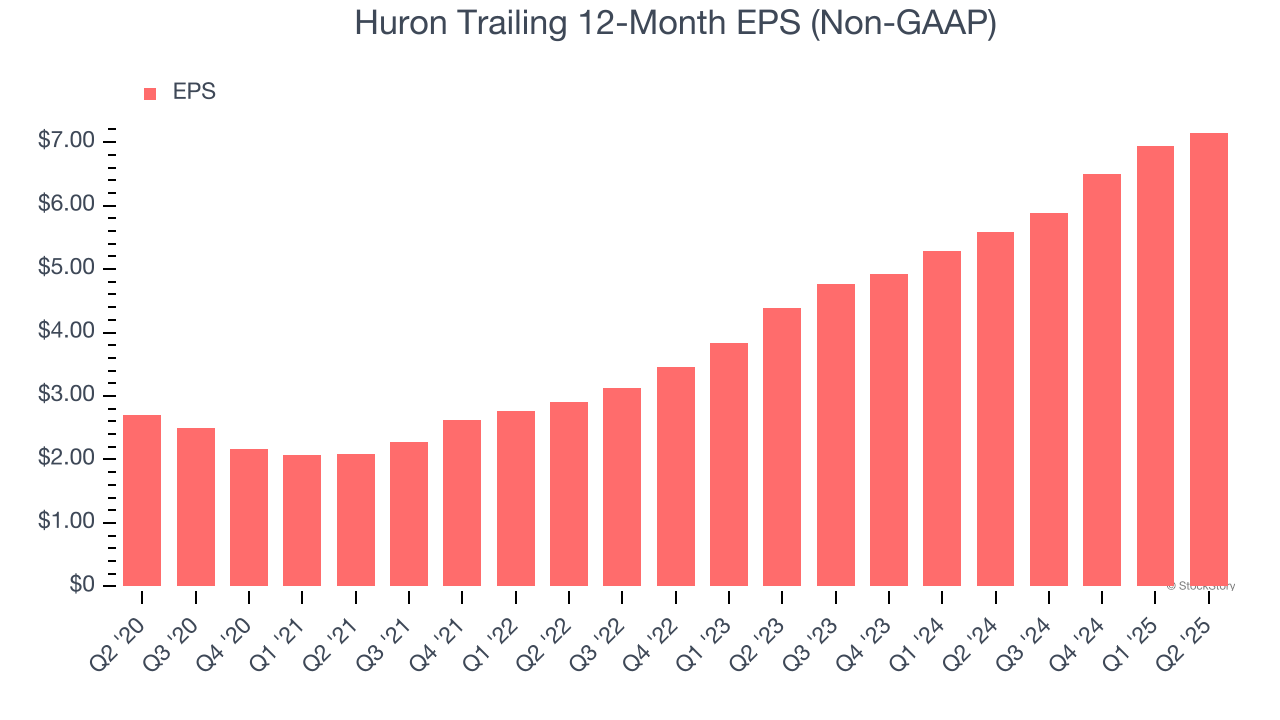
3. Outstanding Long-Term EPS Growth
Analyzing the long-term change in earnings per share (EPS) shows whether a company's incremental sales were profitable – for example, revenue could be inflated through excessive spending on advertising and promotions.
Huron’s EPS grew at an astounding 21.5% compounded annual growth rate over the last five years, higher than its 10.6% annualized revenue growth. This tells us the company became more profitable on a per-share basis as it expanded.
Final Judgment
These are just a few reasons why we think Huron is a high-quality business. With the recent decline, the stock trades at 17.8× forward P/E (or $136.57 per share). Is now a good time to initiate a position? See for yourself in our full research report, it’s free.
Stocks We Like Even More Than Huron
When Trump unveiled his aggressive tariff plan in April 2025, markets tanked as investors feared a full-blown trade war. But those who panicked and sold missed the subsequent rebound that’s already erased most losses.
Don’t let fear keep you from great opportunities and take a look at Top 5 Strong Momentum Stocks for this week. This is a curated list of our High Quality stocks that have generated a market-beating return of 183% over the last five years (as of March 31st 2025).
Stocks that made our list in 2020 include now familiar names such as Nvidia (+1,545% between March 2020 and March 2025) as well as under-the-radar businesses like the once-small-cap company Exlservice (+354% five-year return). Find your next big winner with StockStory today.
StockStory is growing and hiring equity analyst and marketing roles. Are you a 0 to 1 builder passionate about the markets and AI? See the open roles here.