Department store chain Kohl’s (NYSE: KSS) announced better-than-expected revenue in Q2 CY2025, but sales fell by 5% year on year to $3.55 billion. Its non-GAAP profit of $0.56 per share was 88.6% above analysts’ consensus estimates.
Is now the time to buy Kohl's? Find out by accessing our full research report, it’s free.
Kohl's (KSS) Q2 CY2025 Highlights:
- Revenue: $3.55 billion vs analyst estimates of $3.50 billion (5% year-on-year decline, 1.4% beat)
- Adjusted EPS: $0.56 vs analyst estimates of $0.30 (88.6% beat)
- Adjusted EBITDA: $462 million vs analyst estimates of $307 million (13% margin, 50.5% beat)
- Adjusted EPS guidance for the full year is $0.65 at the midpoint, beating analyst estimates by 29.5%
- Operating Margin: 7.9%, up from 4.4% in the same quarter last year
- Free Cash Flow Margin: 14.3%, up from 3.8% in the same quarter last year
- Same-Store Sales fell 4.2% year on year, in line with the same quarter last year
- Market Capitalization: $1.46 billion
Michael Bender, Kohl’s Interim Chief Executive Officer, said “Kohl’s second quarter performance is a testament to the progress we are making against our 2025 initiatives. This resulted in sales performance that came in ahead of our expectations. While it is clear that these initiatives are beginning to resonate with our customers, our team remains focused on delivering progressive improvement throughout the remainder of the year against a challenging economic backdrop.
Company Overview
Founded as a corner grocery store in Milwaukee, Wisconsin, Kohl’s (NYSE: KSS) is a department store chain that sells clothing, cosmetics, electronics, and home goods.
Revenue Growth
Reviewing a company’s long-term sales performance reveals insights into its quality. Any business can experience short-term success, but top-performing ones enjoy sustained growth for years.
With $15.89 billion in revenue over the past 12 months, Kohl's is one of the larger companies in the consumer retail industry and benefits from a well-known brand that influences purchasing decisions. However, its scale is a double-edged sword because there are only a finite number of places to build new stores, making it harder to find incremental growth. To expand meaningfully, Kohl's likely needs to tweak its prices or enter new markets.
As you can see below, Kohl’s demand was weak over the last six years (we compare to 2019 to normalize for COVID-19 impacts). Its sales fell by 3.7% annually as it didn’t open many new stores and observed lower sales at existing, established locations.
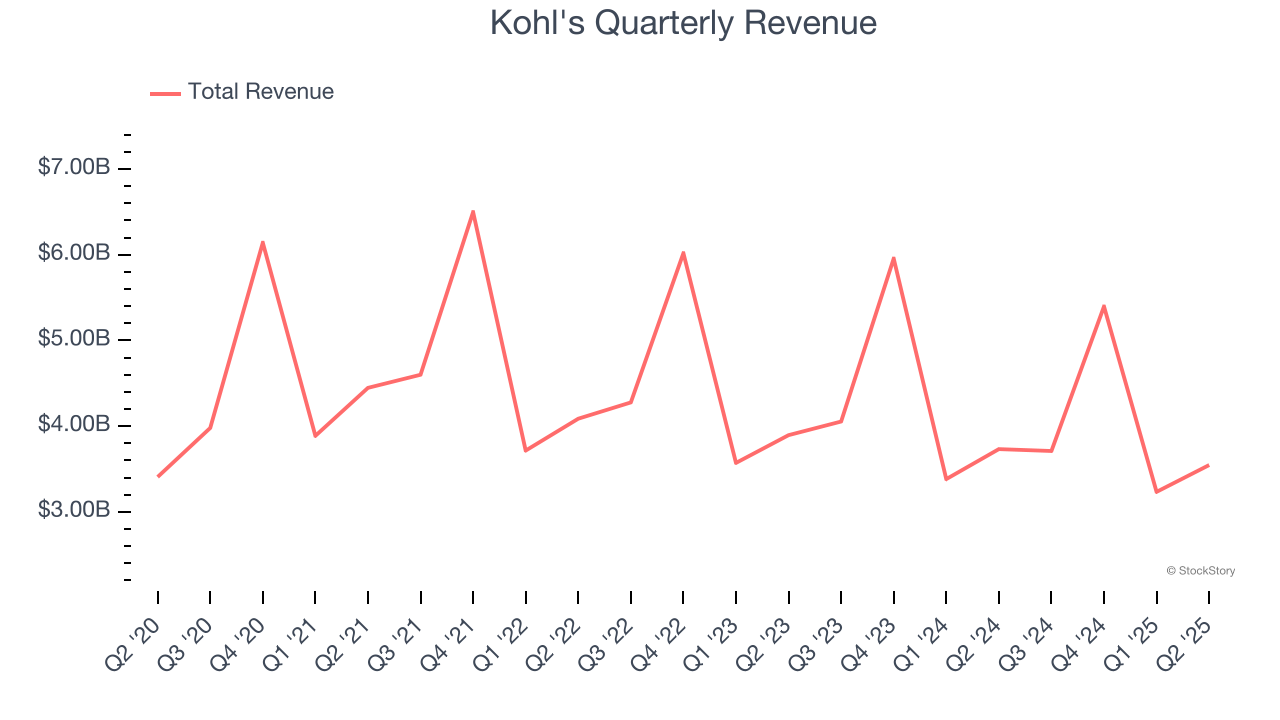
This quarter, Kohl’s revenue fell by 5% year on year to $3.55 billion but beat Wall Street’s estimates by 1.4%.
Looking ahead, sell-side analysts expect revenue to decline by 4.2% over the next 12 months, similar to its six-year rate. This projection doesn't excite us and implies its newer products will not accelerate its top-line performance yet.
Unless you’ve been living under a rock, it should be obvious by now that generative AI is going to have a huge impact on how large corporations do business. While Nvidia and AMD are trading close to all-time highs, we prefer a lesser-known (but still profitable) stock benefiting from the rise of AI. Click here to access our free report one of our favorites growth stories.
Store Performance
Number of Stores
The number of stores a retailer operates is a critical driver of how quickly company-level sales can grow.
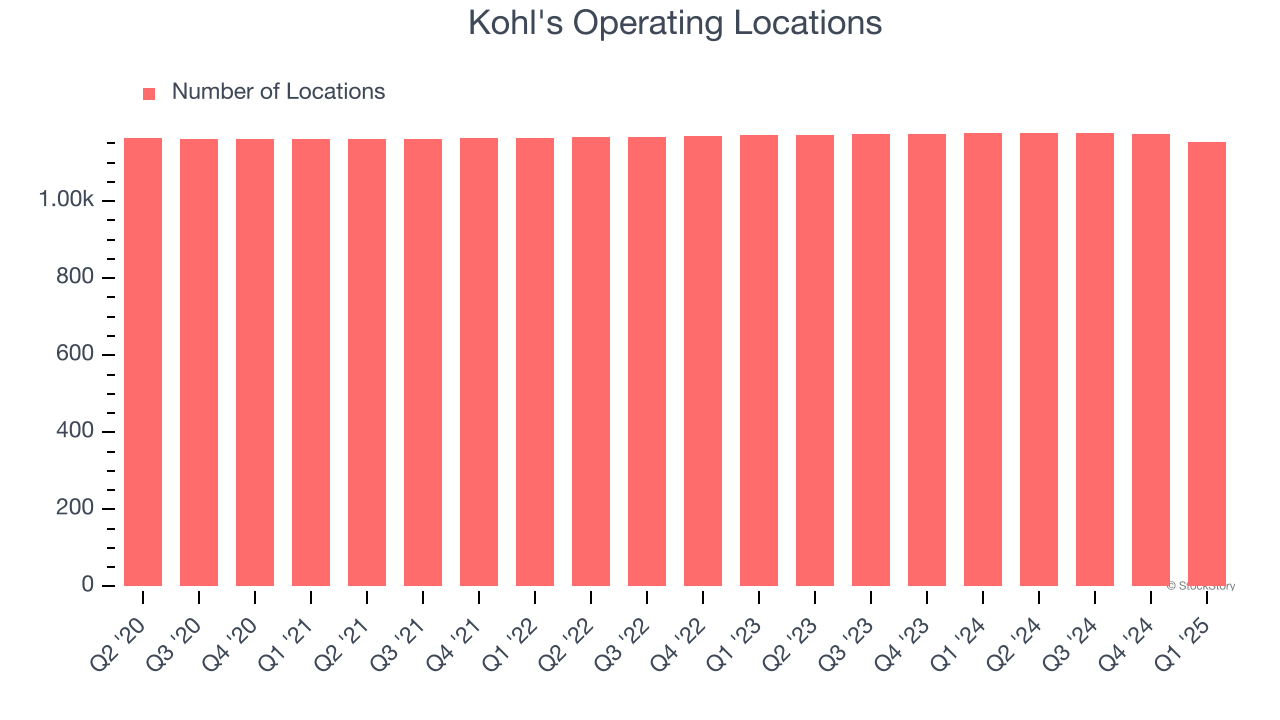
Over the last two years, Kohl's has kept its store count flat while other consumer retail businesses have opted for growth.
When a retailer keeps its store footprint steady, it usually means demand is stable and it’s focusing on operational efficiency to increase profitability.
Note that Kohl's reports its store count intermittently, so some data points are missing in the chart below.
Same-Store Sales
The change in a company's store base only tells one side of the story. The other is the performance of its existing locations and e-commerce sales, which informs management teams whether they should expand or downsize their physical footprints. Same-store sales provides a deeper understanding of this issue because it measures organic growth at brick-and-mortar shops for at least a year.
Kohl’s demand has been shrinking over the last two years as its same-store sales have averaged 5.4% annual declines. This performance isn’t ideal, and we’d be concerned if Kohl's starts opening new stores to artificially boost revenue growth.
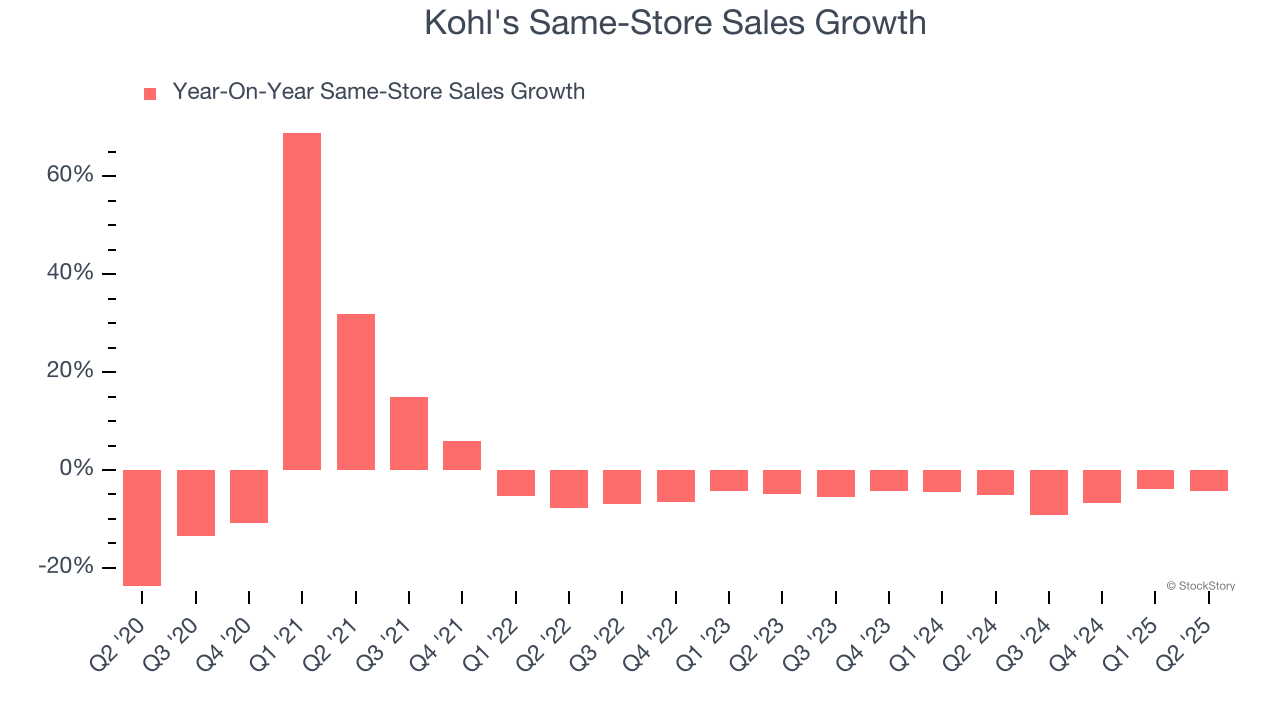
In the latest quarter, Kohl’s same-store sales fell by 4.2% year on year. This decrease represents a further deceleration from its historical levels. We hope the business can get back on track.
Key Takeaways from Kohl’s Q2 Results
It was good to see Kohl's beat analysts’ EPS expectations this quarter. We were also excited its gross margin outperformed Wall Street’s estimates by a wide margin. Zooming out, we think this was a good print with some key areas of upside. The stock traded up 18.8% to $15.49 immediately following the results.
Indeed, Kohl's had a rock-solid quarterly earnings result, but is this stock a good investment here? When making that decision, it’s important to consider its valuation, business qualities, as well as what has happened in the latest quarter. We cover that in our actionable full research report which you can read here, it’s free.