
Lucid currently trades at $2.13 per share and has shown little upside over the past six months, posting a small loss of 4.5%. The stock also fell short of the S&P 500’s 10.3% gain during that period.
Is there a buying opportunity in Lucid, or does it present a risk to your portfolio? See what our analysts have to say in our full research report, it’s free.
Why Is Lucid Not Exciting?
We're cautious about Lucid. Here are three reasons there are better opportunities than LCID and a stock we'd rather own.
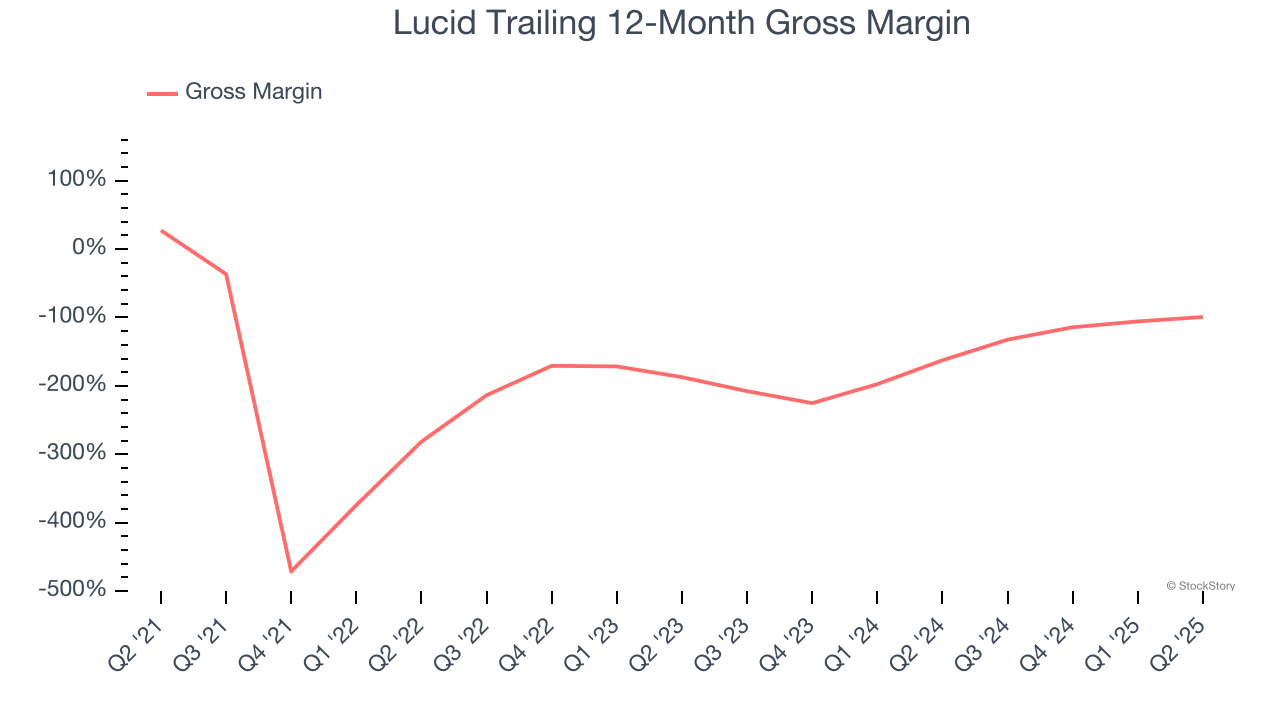
1. Low Gross Margin Reveals Weak Structural Profitability
Cost of sales for an industrials business is usually comprised of the direct labor, raw materials, and supplies needed to offer a product or service. These costs can be impacted by inflation and supply chain dynamics.
Lucid has bad unit economics for an industrials business, signaling it operates in a competitive market. This is also because it’s an automobile manufacturer.
Automobile manufacturers have structurally lower profitability as they often break even on the initial sale of vehicles and instead make money on parts and servicing, which come many years later - this explains why new entrants whose fleets are too young to generate substantial aftermarket revenues have negative gross margins. As you can see below, these dynamics culminated in an average negative 155% gross margin for Lucid over the last five years.
2. Cash Burn Ignites Concerns
Free cash flow isn't a prominently featured metric in company financials and earnings releases, but we think it's telling because it accounts for all operating and capital expenses, making it tough to manipulate. Cash is king.
Lucid’s demanding reinvestments have drained its resources over the last five years, putting it in a pinch and limiting its ability to return capital to investors. Its free cash flow margin averaged negative 522%, meaning it lit $522.38 of cash on fire for every $100 in revenue.
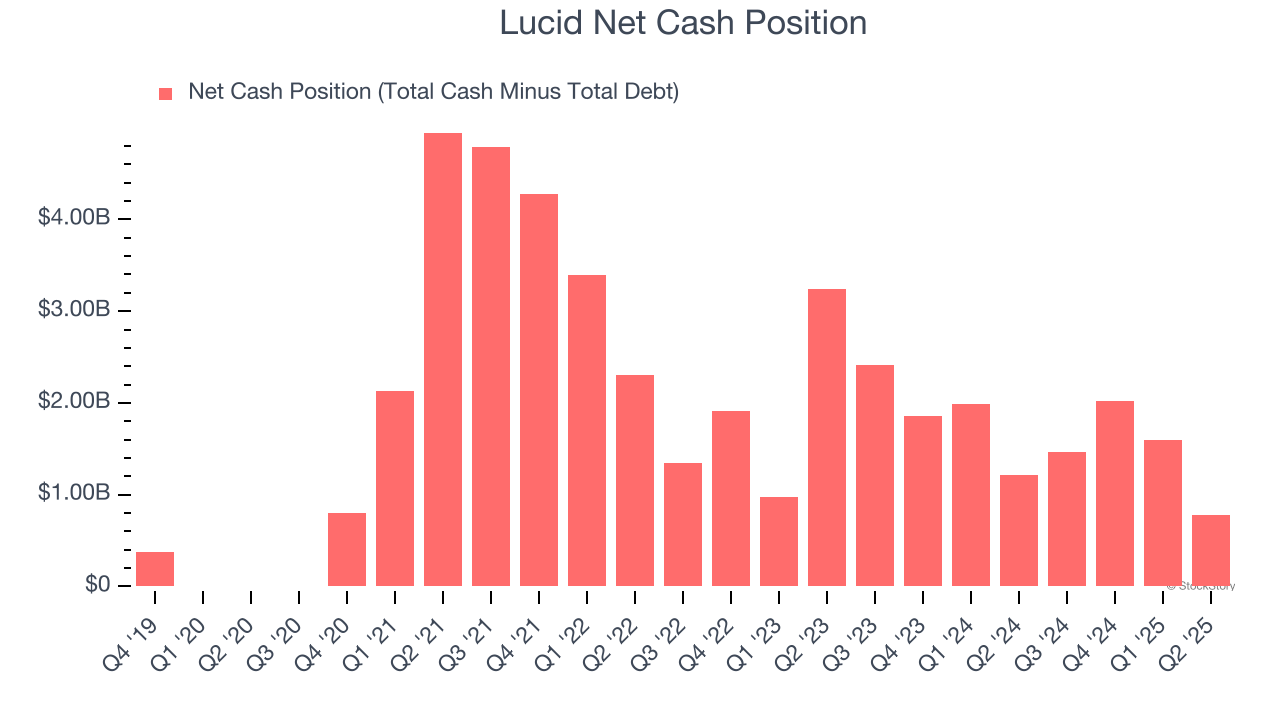
3. Short Cash Runway Exposes Shareholders to Potential Dilution
As long-term investors, the risk we care about most is the permanent loss of capital, which can happen when a company goes bankrupt or raises money from a disadvantaged position. This is separate from short-term stock price volatility, something we are much less bothered by.
Lucid burned through $3.05 billion of cash over the last year. With $2.83 billion of cash on its balance sheet, the company has around 11 months of runway left (assuming its $2.05 billion of debt isn’t due right away).
Unless the Lucid’s fundamentals change quickly, it might find itself in a position where it must raise capital from investors to continue operating. Whether that would be favorable is unclear because dilution is a headwind for shareholder returns.
We remain cautious of Lucid until it generates consistent free cash flow or any of its announced financing plans materialize on its balance sheet.
Final Judgment
Lucid isn’t a terrible business, but it isn’t one of our picks. With its shares trailing the market in recent months, the stock trades at $2.13 per share (or a forward price-to-sales ratio of 3.4×). The market typically values companies like Lucid based on their anticipated profits for the next 12 months, but it expects the business to lose money. We also think the upside isn’t great compared to the potential downside here - there are more exciting stocks to buy. We’d suggest looking at the most dominant software business in the world.
Stocks We Like More Than Lucid
Trump’s April 2025 tariff bombshell triggered a massive market selloff, but stocks have since staged an impressive recovery, leaving those who panic sold on the sidelines.
Take advantage of the rebound by checking out our Top 9 Market-Beating Stocks. This is a curated list of our High Quality stocks that have generated a market-beating return of 183% over the last five years (as of March 31st 2025).
Stocks that made our list in 2020 include now familiar names such as Nvidia (+1,545% between March 2020 and March 2025) as well as under-the-radar businesses like the once-small-cap company Comfort Systems (+782% five-year return). Find your next big winner with StockStory today.
StockStory is growing and hiring equity analyst and marketing roles. Are you a 0 to 1 builder passionate about the markets and AI? See the open roles here.


